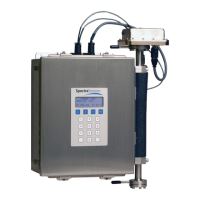
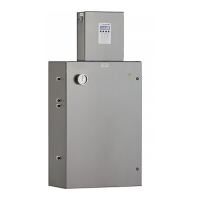
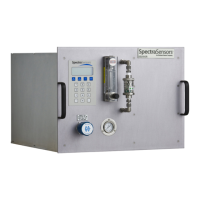
Introduction
Hardware Manual 1
–5
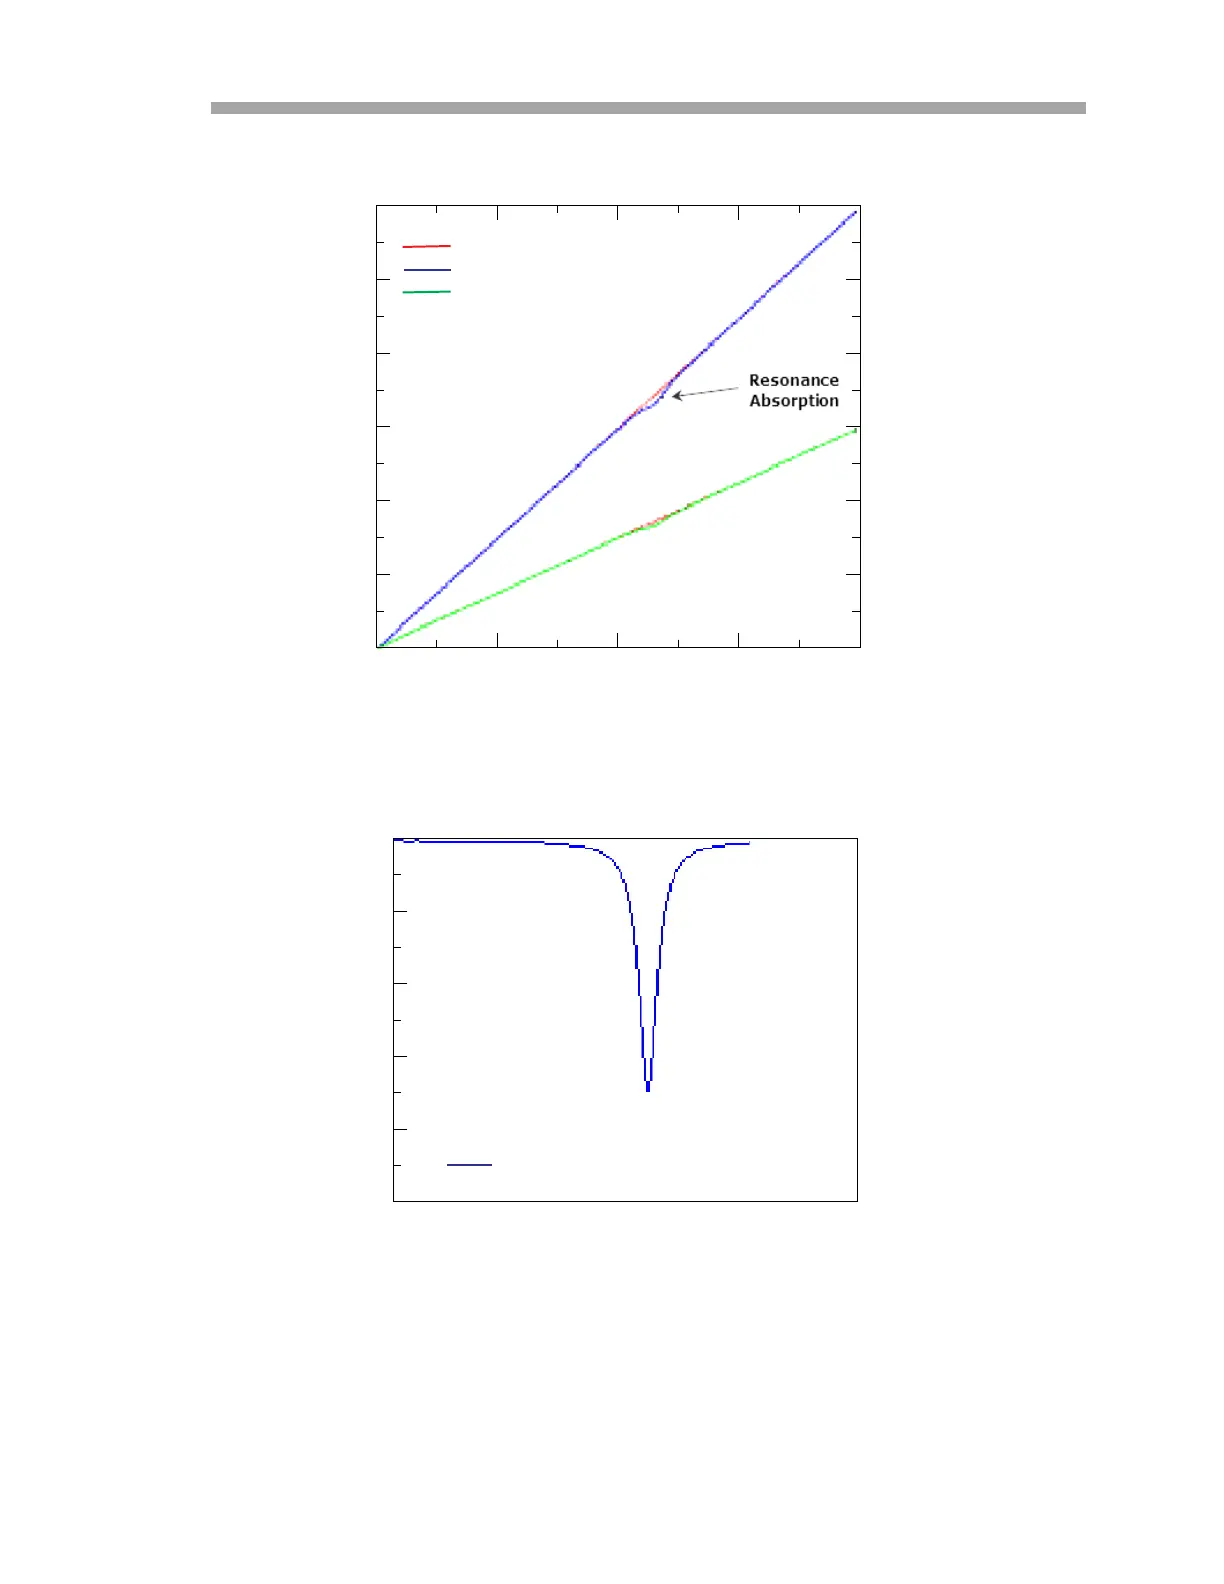
Note that contamination of the mirrors results solely in lower overall signal.
However, by tuning the laser off-resonance as well as on-resonance and
normalizing the data, the technique self calibrates every scan resulting in
measurements that are unaffected by mirror contamination.
3.0
2.5
2.0
1.5
1.0
0.5
Incident Energy I
0
()
Raw Signal, I()
Raw Signal, I()
(Contaminated Mirrors)
Wavelength [a.u.]
Signal [a.u.]
0.0
Figure 1–2 Typical raw signal from a laser diode
absorption spectrometer with and without mirror
contamination
1.0
0.99
0.98
0.97
0.96
0.95
Normalized Absorption Signal
Wavelength [a.u.]
Signal [a.u.]
Figure 1–3 Typical normalized absorption signal
from a laser diode absorption spectrometer
 Loading...