Hardware Manual iii
LIST OF FIGURES
Figure 1–1. Schematic of a typical tunable diode laser
absorption spectrometer . . . . . . . . . . . . . . . . . . . . . . . . . . . . . . 1-4
Figure 1–2. Typical raw signal from a laser diode absorption spectrometer
with and without mirror contamination . . . . . . . . . . . . . . . . . . . . 1-5
Figure 1–3. Typical normalized absorption signal from a laser diode
absorption spectrometer . . . . . . . . . . . . . . . . . . . . . . . . . . . . . . 1-5
Figure 1–4. Typical normalized 2f signal; species concentration is
proportional to the peak height . . . . . . . . . . . . . . . . . . . . . . . . . 1-6
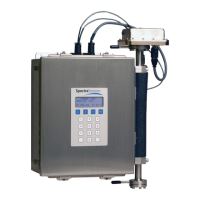
Figure 1–5. View of front and rear panels of the analyzer . . . . . . . . . . . . . . . . 1-8
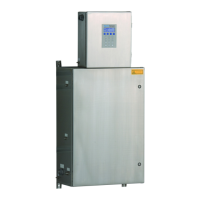
Figure 1–6. View of inside the analyzer enclosure with top panels removed . . . 1-9
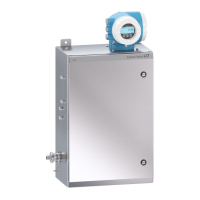
Figure 1–7. View of right and left sides of analyzer enclosure with side
panels removed . . . . . . . . . . . . . . . . . . . . . . . . . . . . . . . . . . . 1-10
Figure 1–8. Analyzer electronics assembly . . . . . . . . . . . . . . . . . . . . . . . . . 1-11
Figure 1–9. Label placement on front and rear of analyzer enclosure . . . . . . . 1-14
Figure 1–10. Label placement on the inside of the analyzer enclosure . . . . . . . 1-15
Figure 1–11. Label placement on the analyzer electronics assembly . . . . . . . . 1-16
Figure 2–1. RackSolutions 2USHL-130 heavy-duty sliding shelf for
indoor 19" rack installations . . . . . . . . . . . . . . . . . . . . . . . . . . . . 2-2
Figure 2–2. Analyzer 4-20 mA board . . . . . . . . . . . . . . . . . . . . . . . . . . . . . . 2-6
Figure 3–1. Predicted scrubber lifetime based on average H
2
S load . . . . . . . . . 3-2
Figure 3–2. Scrubber and scrubber efficiency indicator . . . . . . . . . . . . . . . . . . 3-2
Figure 3–3. H
2
S scrubber efficiency indicator / front view of analyzer . . . . . . . 3-3
Figure 3–4. H
2
S scrubber efficiency indicator before and after breakthrough. . . 3-3
 Loading...