27
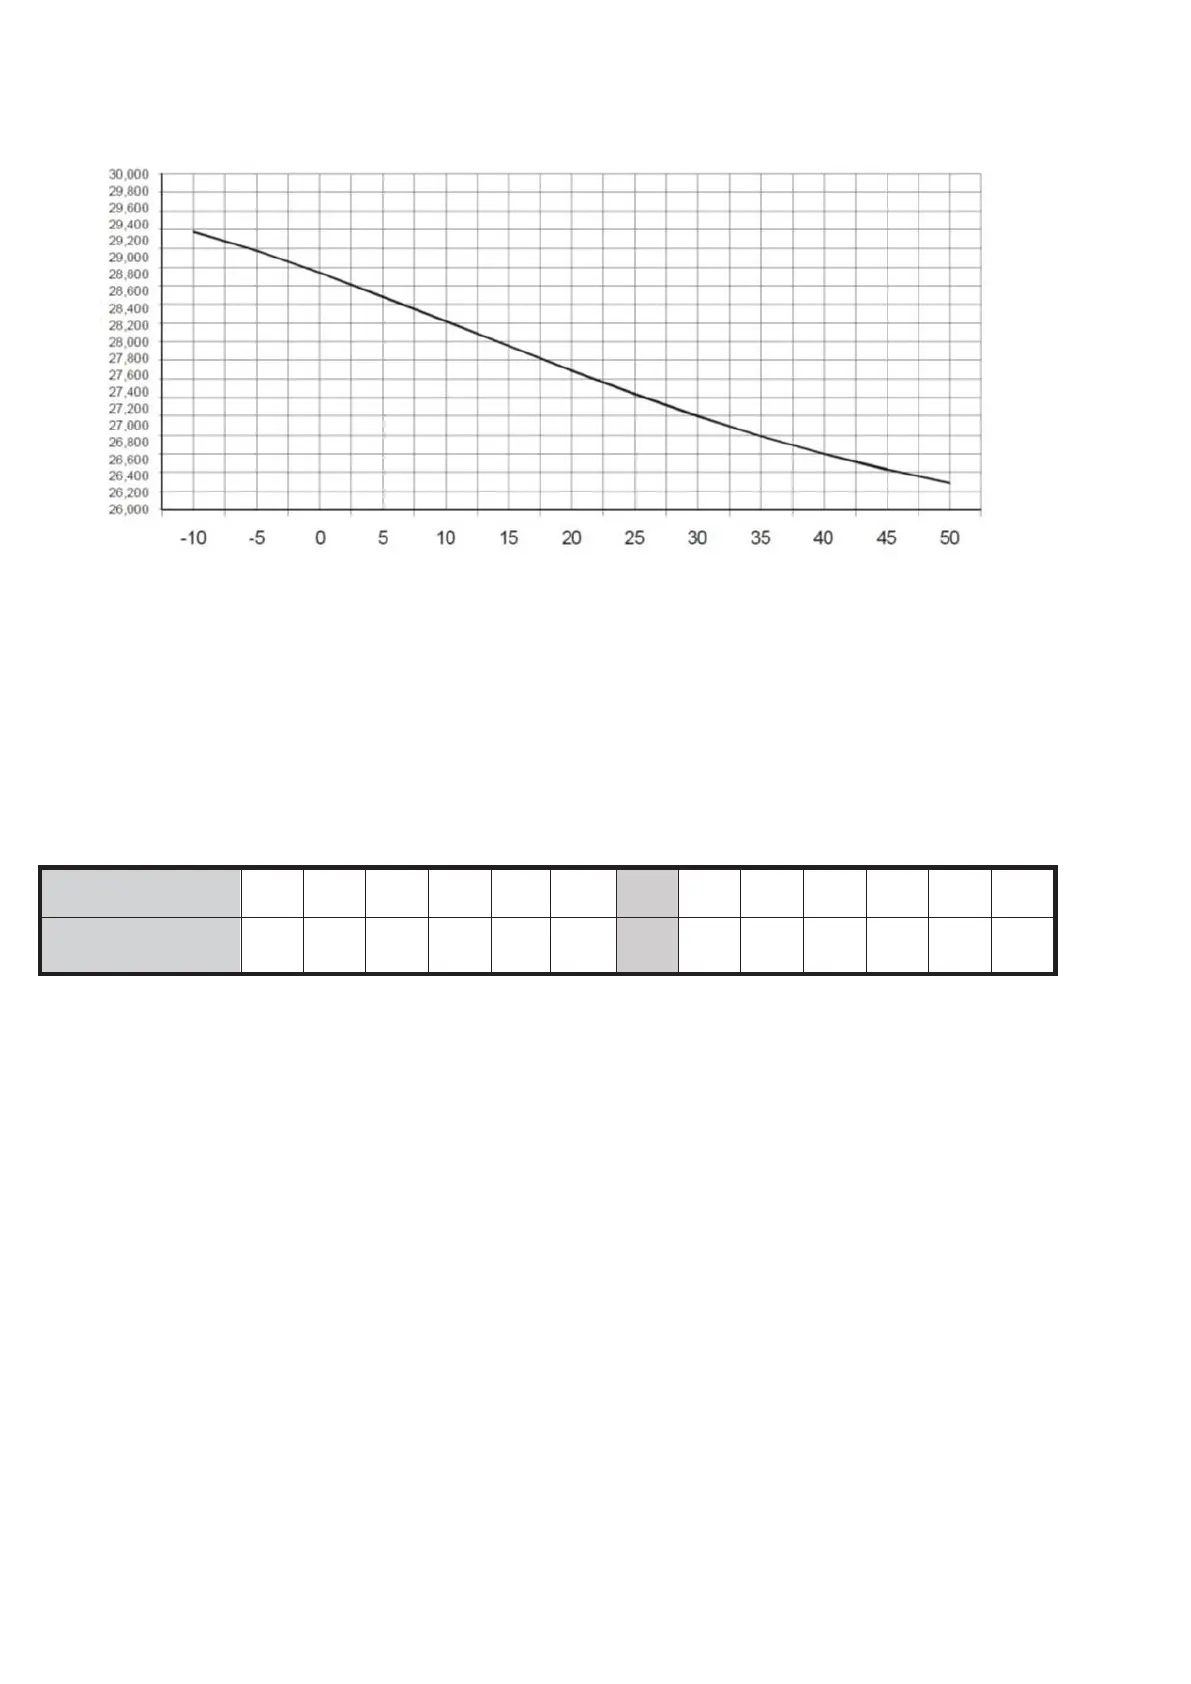
Figure 14: Switching power supply output voltage graph
TEMPERATURE (°C)
Finding the output voltage using the graph
1. Indicate the probe temperature on the TEMPERATURE (°C) axis.
2. Draw a line from the temperature value point up to the curve a) and draw a line from the intersection point across to the VOLTAGE
(V) axis.
3. Adjust the output voltage of the switching power supply to the resultant value. For example, if the probe temperature is 22°C, the
output voltage of the switching power supply must be set at 27.4 V.
Table 6: Switching power supply output voltage chart
Finding the output voltage using the chart
1. Select the nearest value to the probe temperature on the TEMPERATURE (°C) row.
2. Read the respective value on the VOLTAGE (V) row.
3. Adjust the output voltage of the switching power supply to the indicated value. For example, if the probe temperature
is 22 °C, the output voltage of the switching power supply must be set at 27.4 V.