9 Measurement
FLUXUS G809 9.3 Start of the measurement
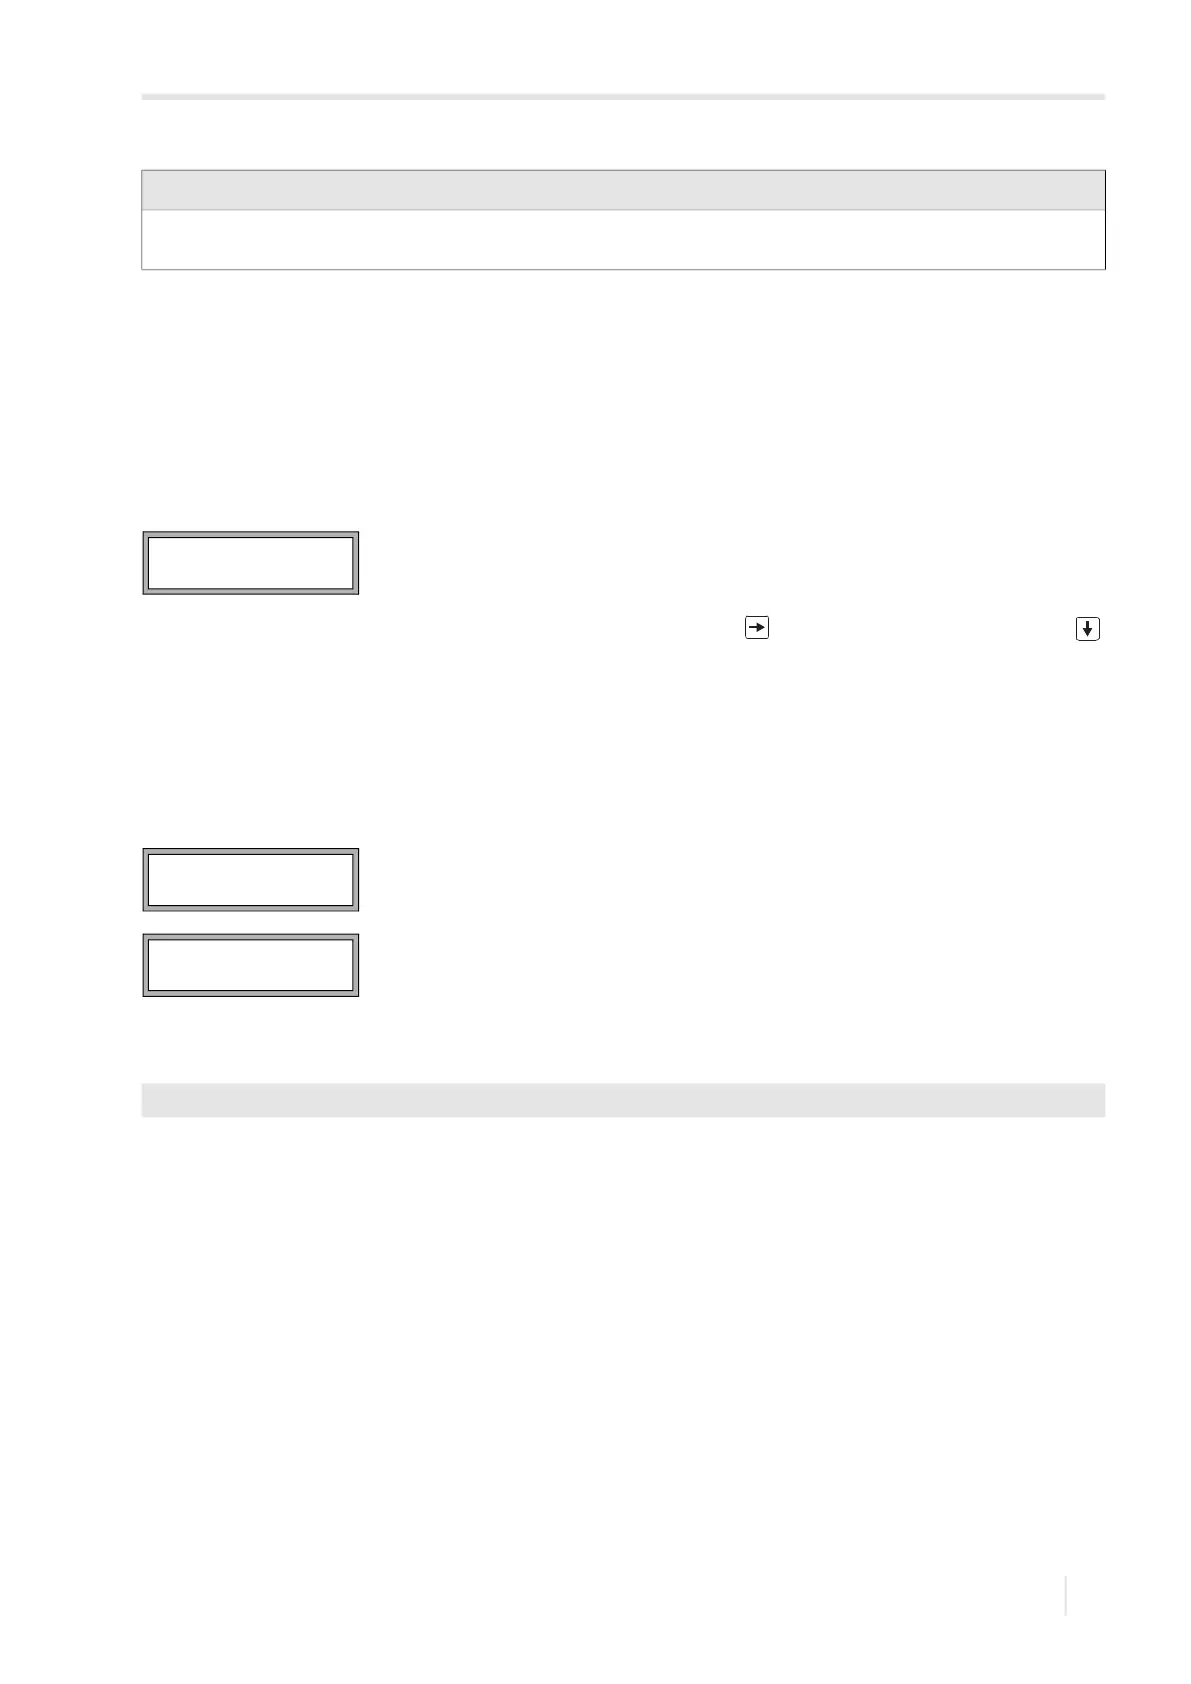
103
UMFLUXUS_G809V2-2EN, 2020-06-25
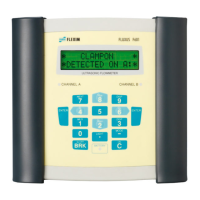
The diagnostics window is displayed, see Fig. 9.1.
Fine adjustment of the transducer distance
• If the displayed transducer distance is adjusted, press ENTER.
The measuring run for the positioning of the transducers is started.
The bar graph S= shows the amplitude of the received signal, see Fig. 9.1.
• Shift one of the transducers slightly within the range of the recommended transducer distance until the bar graph reach-
es the max. length (6 squares).
The following quantities can be displayed in the upper line by pressing key and in the lower line by pressing key ,
see Fig. 9.2:
• ■<>■ transducer distance
• time: transit time of the measuring signal in μs
• S: signal amplitude
• Q: signal quality, bar graph has to have max. length
If the signal is not sufficient for a measurement, Q= UNDEF will be displayed.
In case of large deviations, check if the entered parameters are correct or repeat the measurement at a different point on
the pipe.
After the precise transducer positioning, the recommended transducer distance is displayed again.
• Enter the current (exact) transducer distance.
• Press ENTER.
Repeat the steps for all channels on which a measurement is made. The measurement will be started automatically.
Afterwards, the measurement will be started automatically.
Notice!
The accuracy of the recommended transducer distance depends on the accuracy of the entered pipe and fluid
parameters.
Fig. 9.1: Diagnostics window
Fig. 9.2: Diagnostics window
Measuring\...\Transd. Distance\54 mm
S=■■■■■■
A:■<>■=53.9 mm!
S=■■■■■■
Q:■■■■■■■■■■■■
time= 94.0 µs
Q:■■■■■■■■■■■