Fulton ProtoNode Start-up Guide
Page 34 of 47
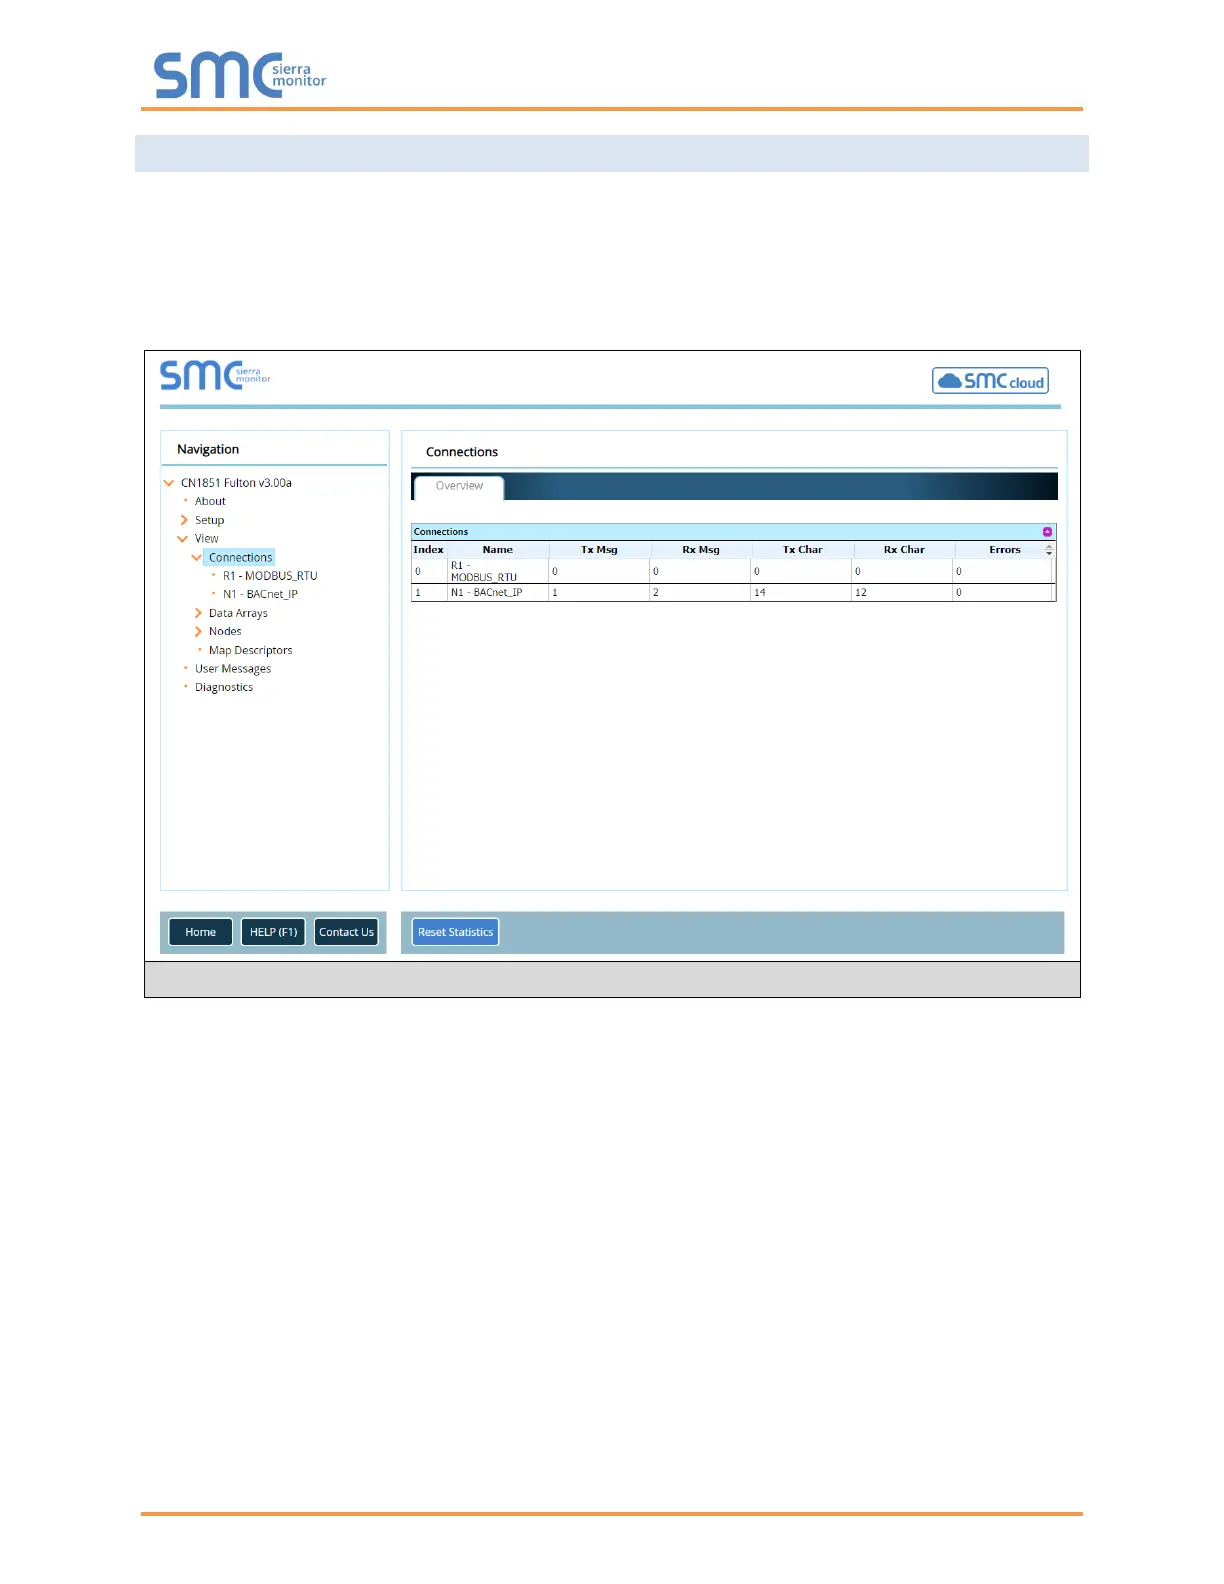
Appendix A.2 Viewing Diagnostic Information
• Type the IP Address of the ProtoNode into the web browser or use the FieldServer Toolbox to
connect to the ProtoNode.
• Click on Diagnostics Button, then click on view, and then on connections.
• If there are any errors showing on the Connections page, refer to Appendix A.3 to check the
wiring and settings.
 Loading...