6.2.7.2 Range Low
This feature is used for selecting the minimum value of the output that should be displayed on the led
display or plotted on the chart is measured by the sensor.
For example:
If the user wants to measure the percentage of pressure of gases in the pressure valve, then then user
needs to display the output in range of 0 to 100 %. So, here the range low should be set as 0 by the
user.
Now, for the above case if the user wants to just measure the percentage of pressure if gone above
50% that is 50-100% then in this case the user should be set the value of range low as 50.
User can set the range low values anywhere between -3276.8 to 3276.7.
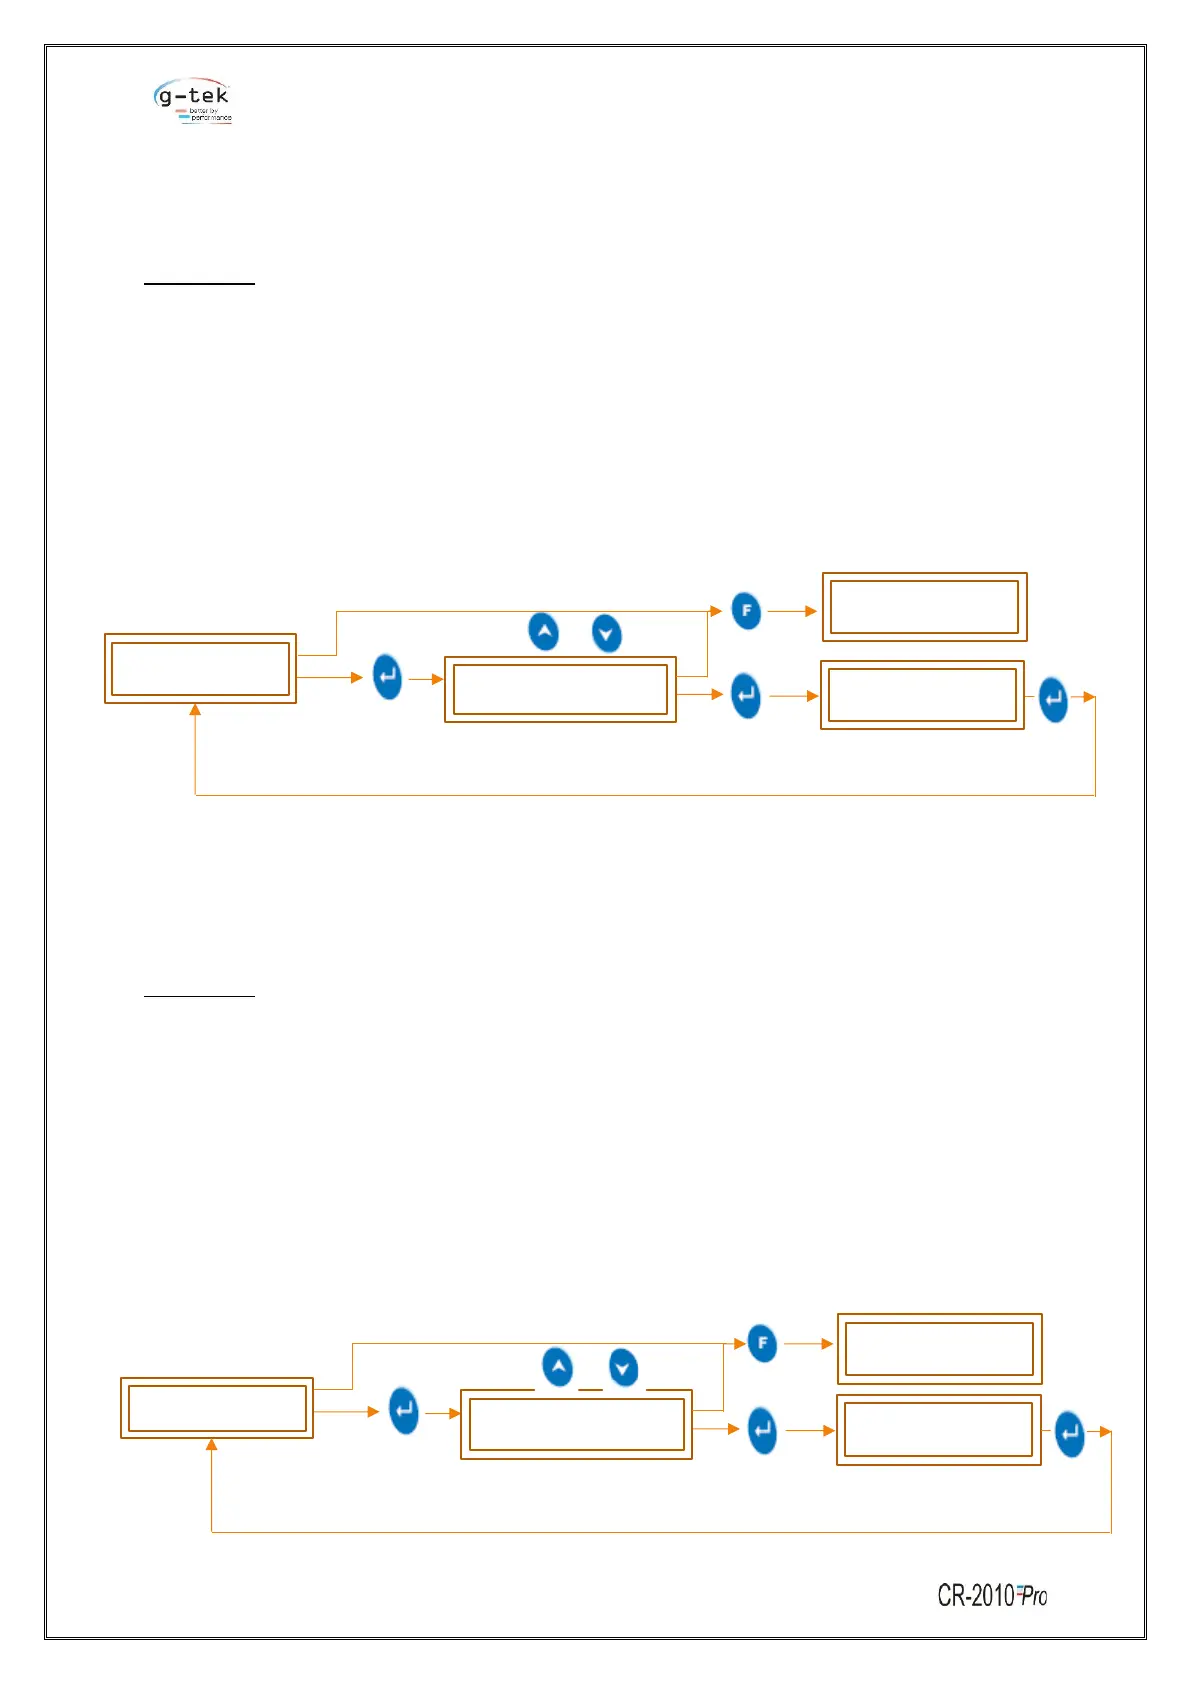
To set the Range Low for single channel then follow the procedure shown in figure- 28 by pressing the
appropriate buttons given in the front panel of the chart recorder.
6.2.7.3 Span
Span is the total range of values that a user wants to measure.
Span value indicates the total interval of which all the output values will be displayed.
For example:
If the user wants to measure the percentage of pressure of gases in the pressure valve, then user
needs to display the output in range of 0 to 100 %. So, here the span should be set as 100 by the user.
Span = (100-0).
Now, for the above case if the user wants to just measure the percentage of pressure if gone above
50% that is 50-100% then in this case the user should set the value of span as 50. Span = (100-50).
User can set the Span value anywhere between -3276.8 to 3276.7.
To set the span for a single channel then follow the procedure shown in figure- 29 by pressing the
appropriate buttons given in the front panel of the chart recorder.
 Loading...