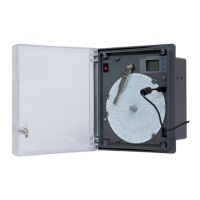
User can set the range low values anywhere between -3276.8 to 3276.7.
To set the Chart zero for single channel then follow the procedure shown in figure- 35 by pressing the
appropriate buttons given in the front panel of the chart recorder.
6.2.7.10 Chart Span
Chart Span is the total range of chart counts when a user wants to plot.
Span value indicates the total interval of which all the count values will be plotted.
For example:
If the user wants to measure and plot temperature between the range of 0 to 100 degree Celsius, then
user can set its Chart Span 100. So, Total CCR will plot the outputs between the range of 0 to 100.
Now, for the above case if the user wants to just measure and plot the temperature above 50-degree
that is 50-100 degree then in this case the user should set the value of chart span as 50 and chart zero
as 50. Chart Span = (100-50).
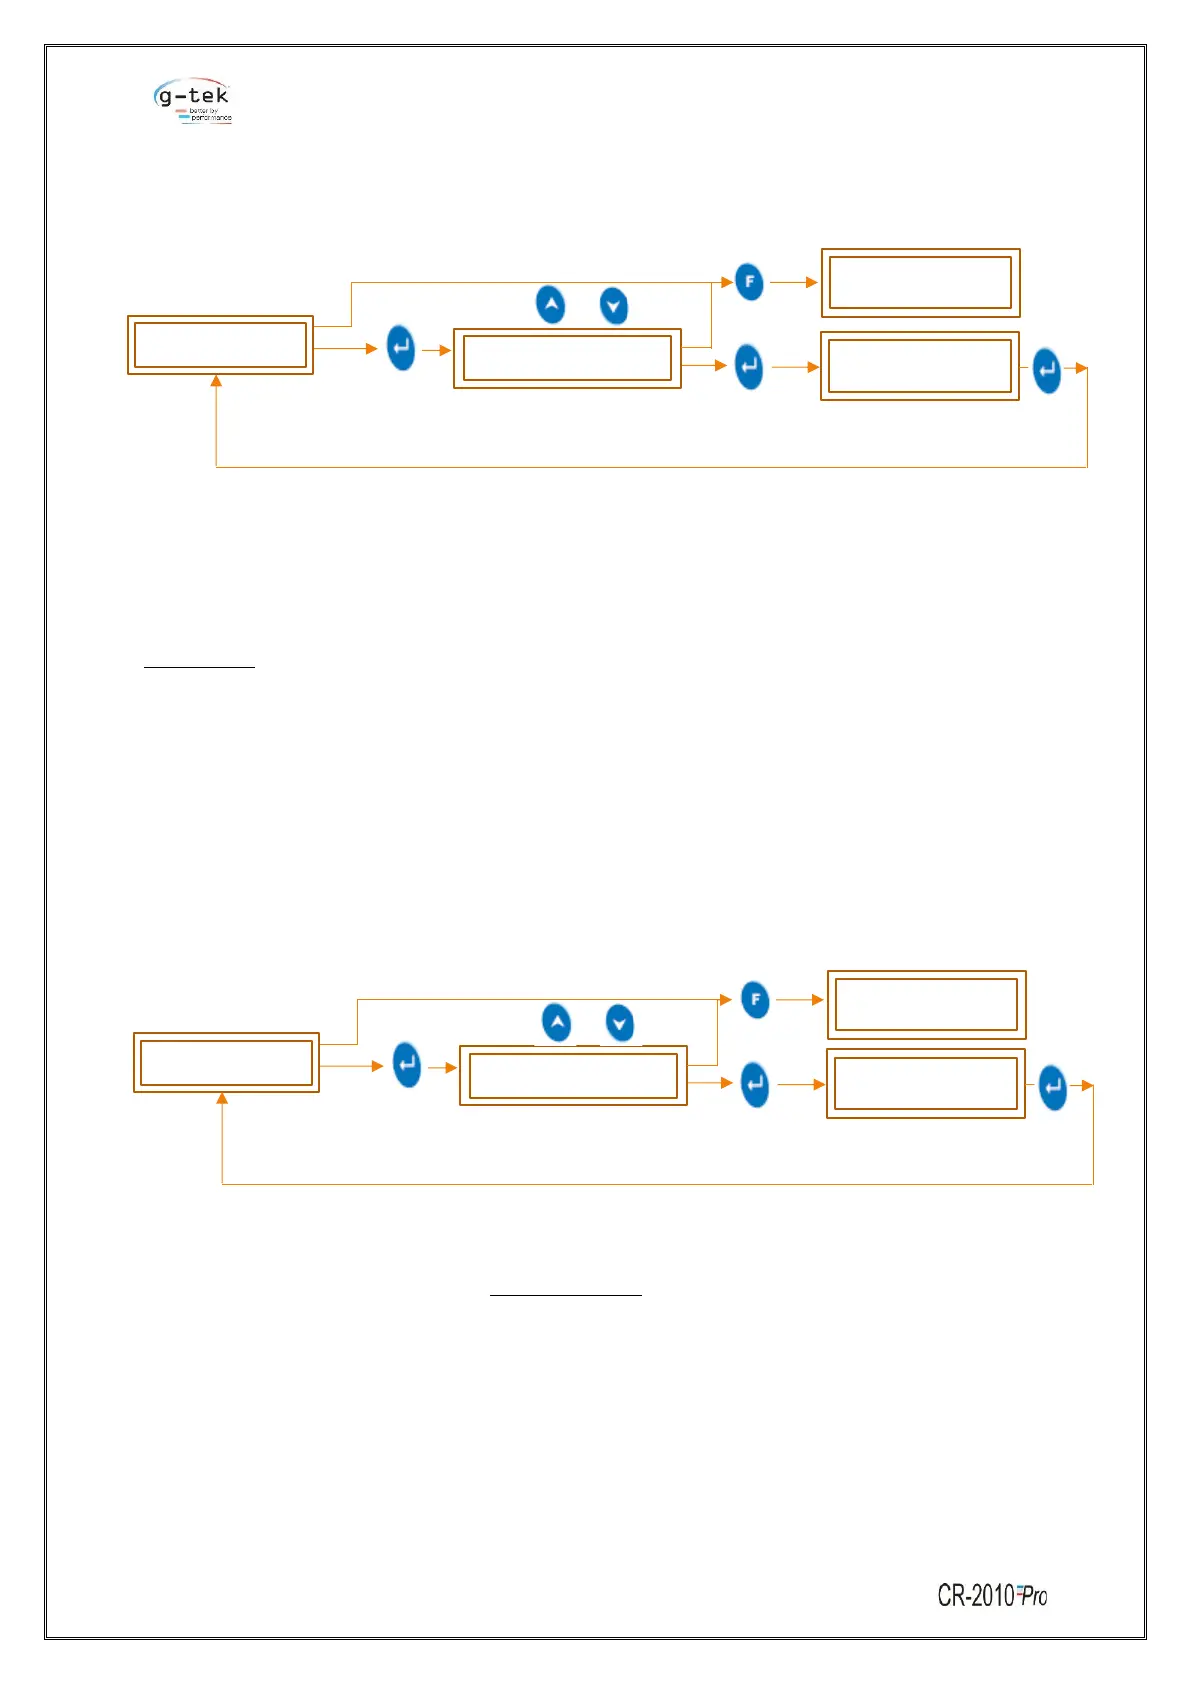
User can set the Span value anywhere between -3276.8 to 3276.7.
To set the chart span for a single channel then follow the procedure shown in figure- 36 by pressing
the appropriate buttons given in the front panel of the chart recorder.
6.2.8 Channel 2
Same as Describe in Type of Functions 6.2.7 CHANNEL 1
 Loading...