27
User Interface
The numeric measurement value at the end of the curve is refreshed every 5 seconds. The
curve is refreshed every 5 seconds in sample mode. In continuous mode, the refreshment rate
is the same as that defined as the storage interval parameter (see Advanced settings on
page 32).
The graphic timescale is displayed at the bottom of the screen. This value can be increased or
decreased (4 zoom levels) by pressing the up and down arrows on the keyboard. These values
are also dependant on the storage interval parameter; the greater the storage interval, the
greater the available timescales.
The measurement scale is calculated automatically with the maximum and minimum values
displayed at the top and bottom of the y axis respectively.
The color of the curve has the following meaning:
• Grey (normal): The channel is out or the measurement is out of range
• Green (bold): The channel is being calibrated
• Grey (bold): The measurement has not started (sample mode only)
• Red (bold): An alarm has been activated
• Blue (bold): Normal measurement
The graphical display is cleared and restarted after the following events:
• At instrument startup
• After a change to the storage mode (see Advanced settings on page 32)
• After a change to the measurement mode (sample or continuous)
• After a change to the current measurement configuration
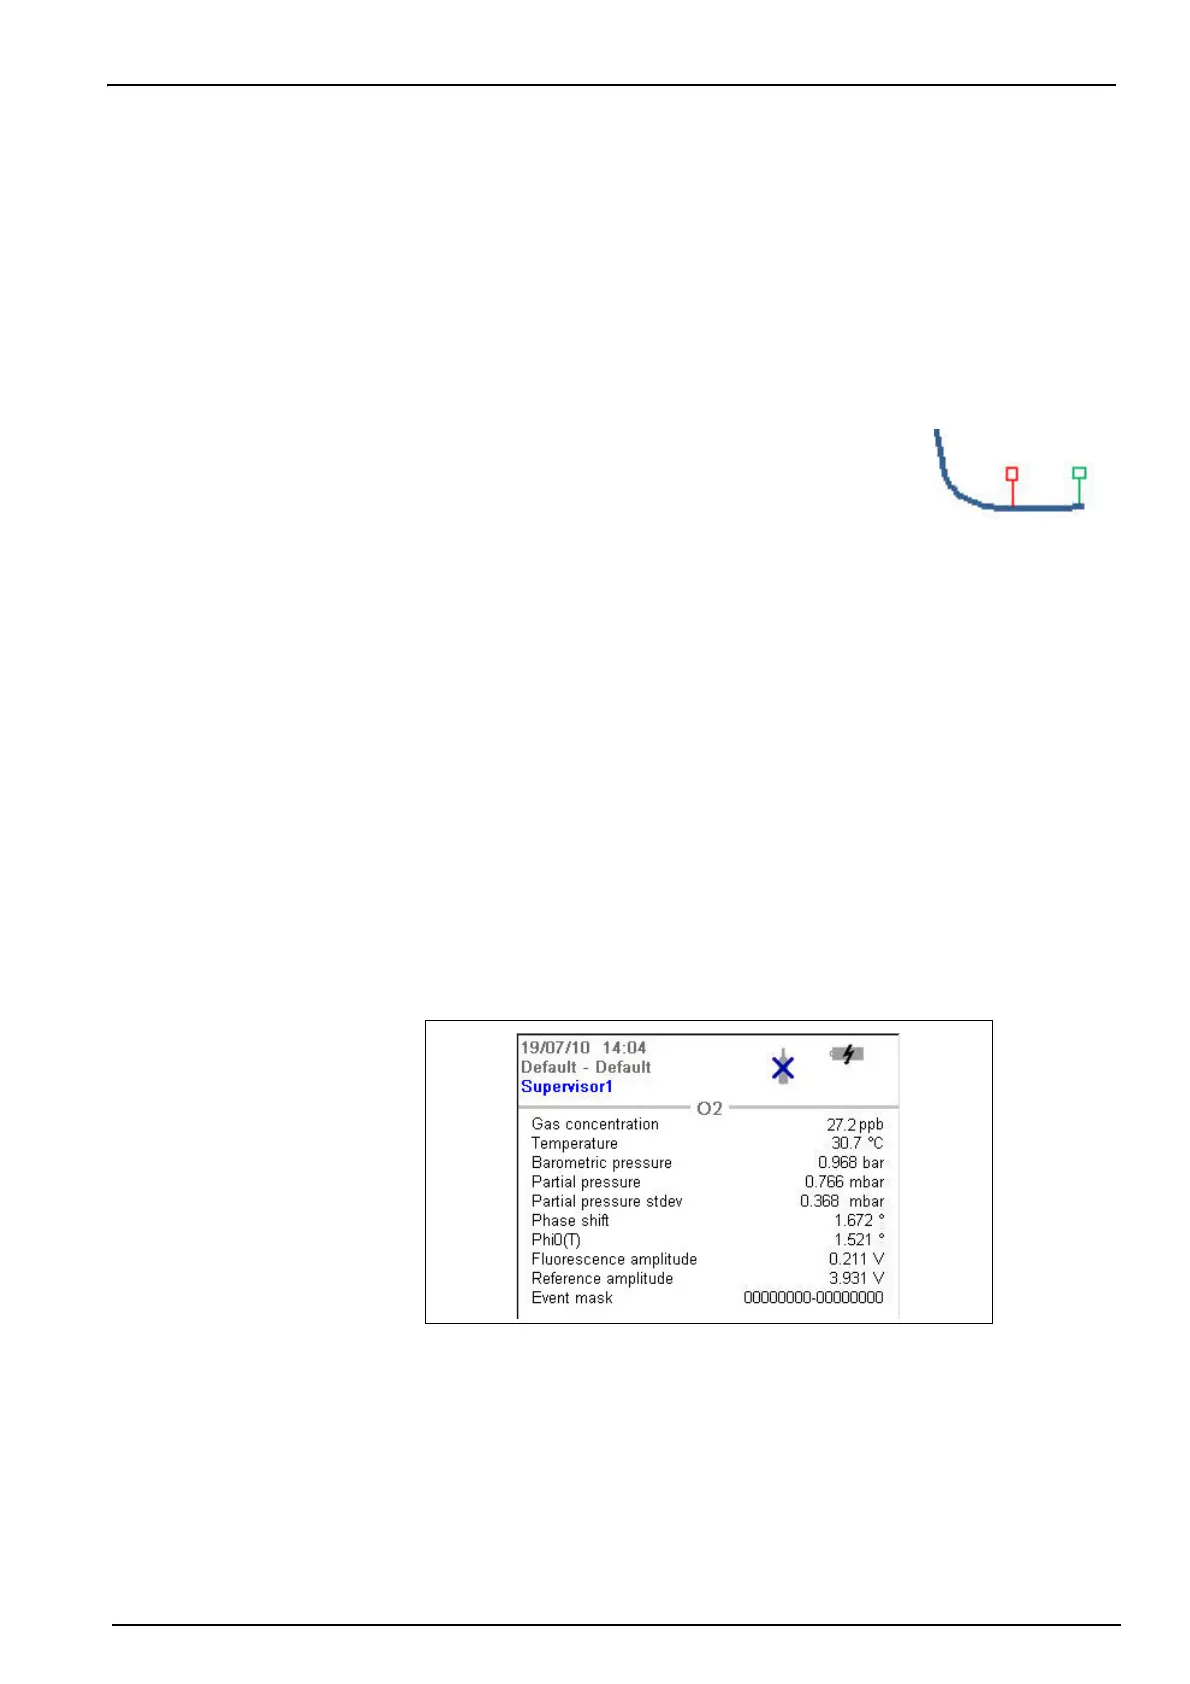
4.4.5 Diagnostic measurement display
The diagnostic measurement display is only accessible if the user is logged on at supervisor
level. To access this display from the standard measurement display screen, press the right
arrow key on the keypad until the following screen is displayed:
The information displayed can be useful for troubleshooting purposes.
Note: There are two event masks at the bottom right of the screen. The first is the common event mask and
the second is the oxygen channel event mask. For details of their meanings refer to the tables in List of
events on page 41.
In sample mode, a symbol is displayed to denote the end of the
measurement (illustrated right). This is displayed in green if the stop
criteria are met, or red to denote an erroneous measurement.