68
H4D
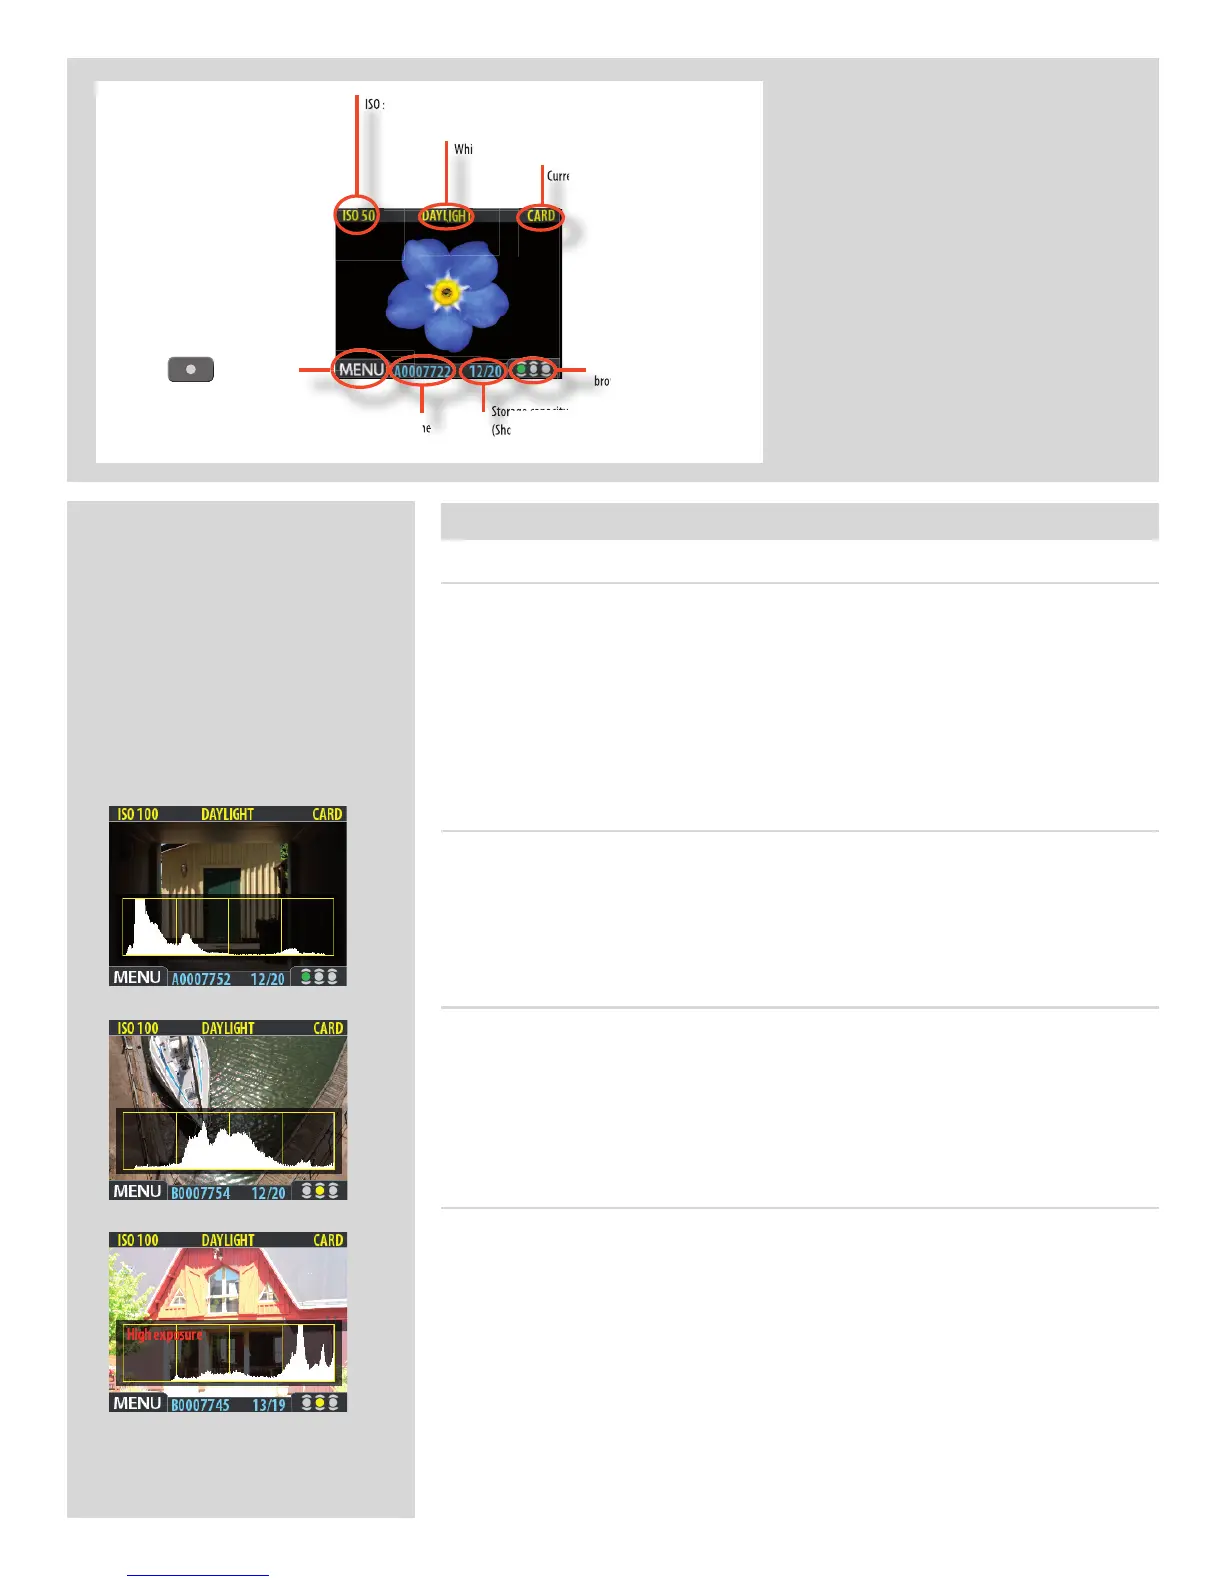
Histogram Mode 1, 2, 3
Usingthehistogram
The histogram provides a graph that indicates the total number of pixels at each bright-
ness level, with brightnesses going from black on the left to white on the right. It is a
valuable tool for evaluating your capture. A well-exposed shot usually has a full range of
levels, while under- and overexposed shots tend to show levels concentrated at the left
or right part of the scale, respectively.
Look at the histogram examples and the explanations below:
Underexposure 1
A histogram display that is concentrated on the left with few pixels elsewhere indicates
a likely underexposure. Many details will be lost in the shadows.
Even exposure 2
A histogram display that is spread across the full range indicates a likely good exposure.
There may still be a few pixels at the extremes, indicating a few spectral highlights and
saturated shadows, but this is often normal in a good exposure.
Overexposure 3
A histogram display that is concentrated on the right with few pixels elsewhere indicates
a likely overexposure. Many details will be lost in the highlights.
The histogram is only an indicator that should be interpreted—there are many situa-
tions in which a questionable histogram will match an exposure that is perfectly accept-
able for the intended e ect (and vice-versa).
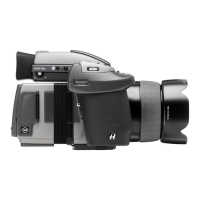
The Standard Preview display is the
one shown when you rst turn on the
camera and is probably the view you
will use most often.
It shows a preview of your most recent
capture and basic information about
the settings.
Furthermore, the display enables you
to navigate the menu system and
make camera settings; see Working
with the Menus for details.
ISOsetting
Whitebalance
Currentstoragemedium
Buttonlabel
Imagelename
Storagecapacity
(Shotstaken/shotsremaining)
Approvalstatusand
browseltersetting