Machine mode of operation | Load monitoring (optional)
4
162
HEIDENHAIN | MANUALplus 620 | User's Manual | 12/2017
Using load monitoring during production
Keep in mind that you cannot adapt the limit values
during machining. Adapt the limit values before starting
a machining operation.
During Program run submode, the control monitors the utilization
and the utilization sum in each interpolator cycle. In parallel with
machining, you can display a graph of the current utilization values
for all monitored axes of the active zone.
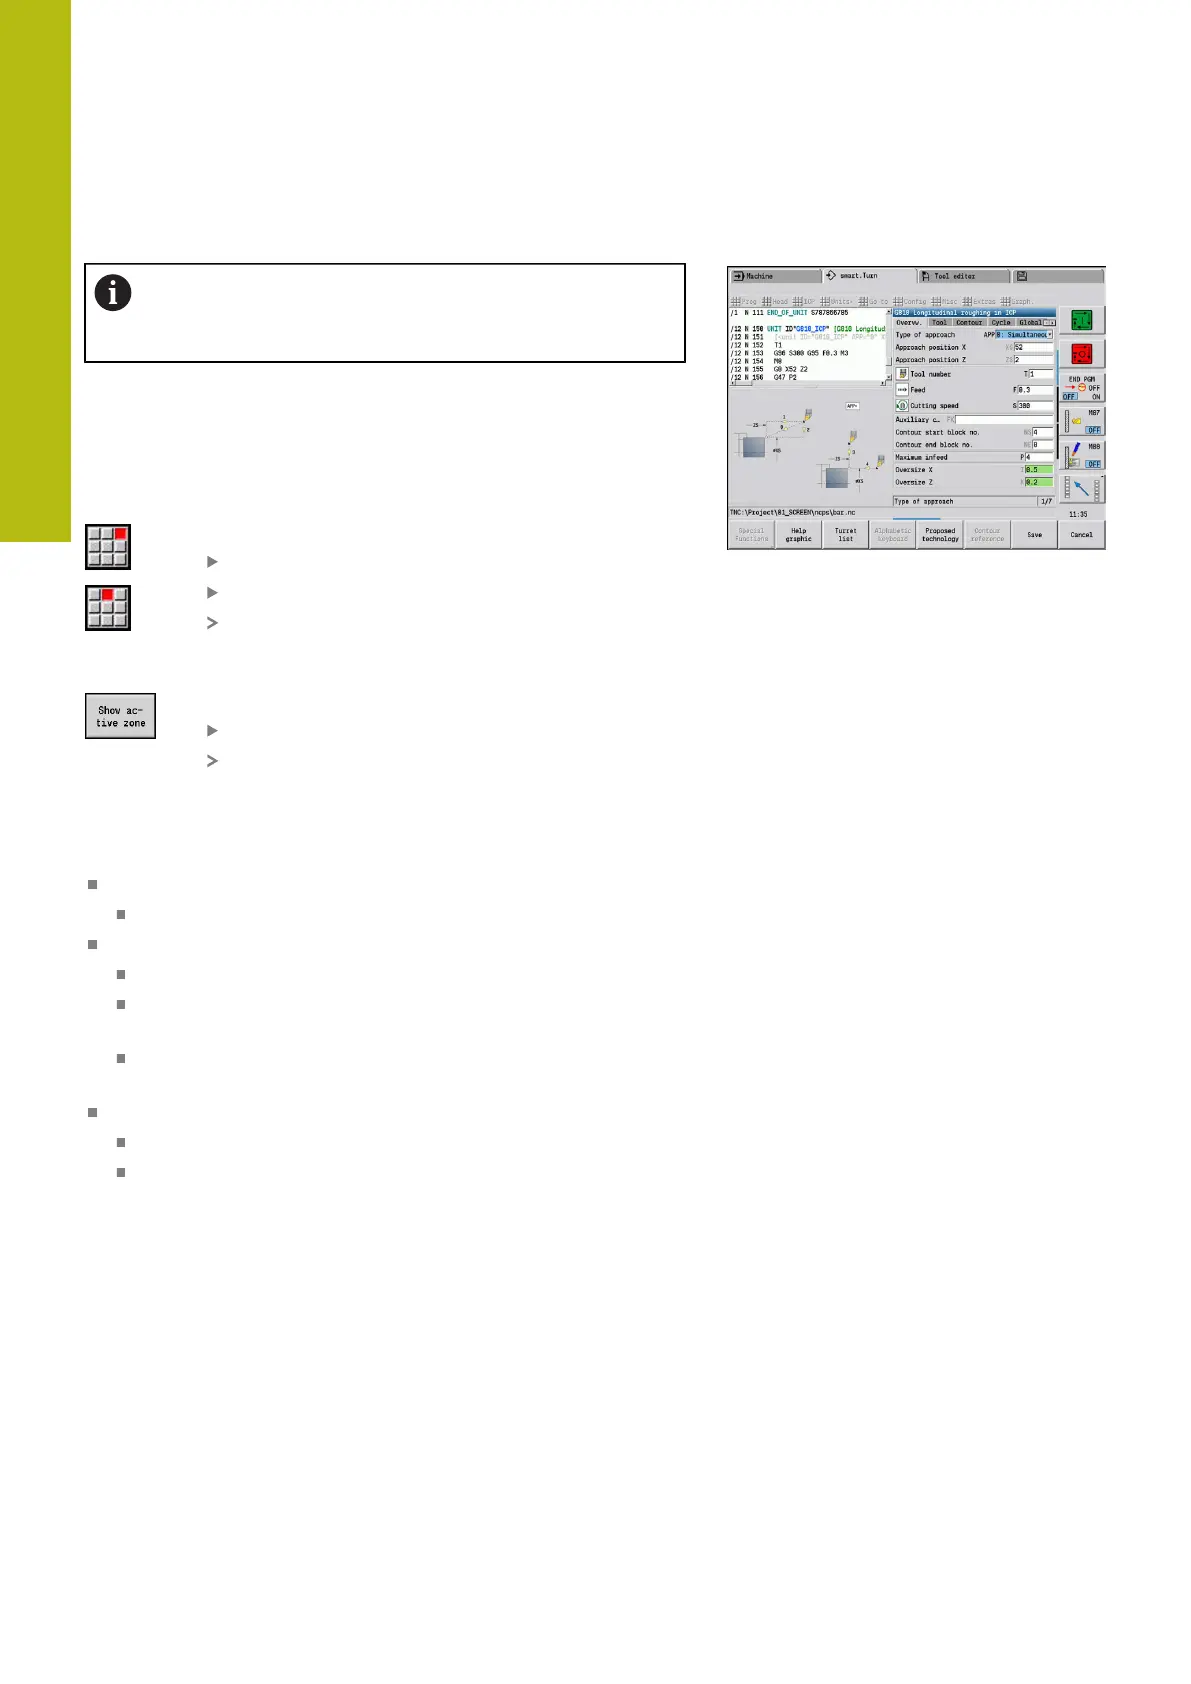
Opening the graph during machining:
Displaying the utilization values:
Select the Display menu item
Select the Edit load data menu item
The control opens the Set load data form and
additionally displays the determined values as a
bar graph
Displaying the current utilization values:
Press the Show active zone soft key
The control automatically switches to the
current monitoring zone and displays the current
utilization values as a bar graph
Bar graph:
Thick upper bar (display in %):
Green: Current utilization (PA)
Thin lower bar (display standardized to reference value 1):
Green: Current peak value between 0 and limit value 1 (P)
Yellow: Current peak value between P and limit value 1
(PG1)
Red: Current peak value between PG1 and limit value 2
(PG1)
Thin lower bar (display standardized to reference value 1):
Green: Current utilization sum (WA)
Yellow: Current utilization sum up to the limit value (WGF)

 Loading...