4.7 Displaying a Graph of Saved Recording Data
59
3
4
Chapter 4 Measurement and Analysis
Other Data Viewing Screen Functions
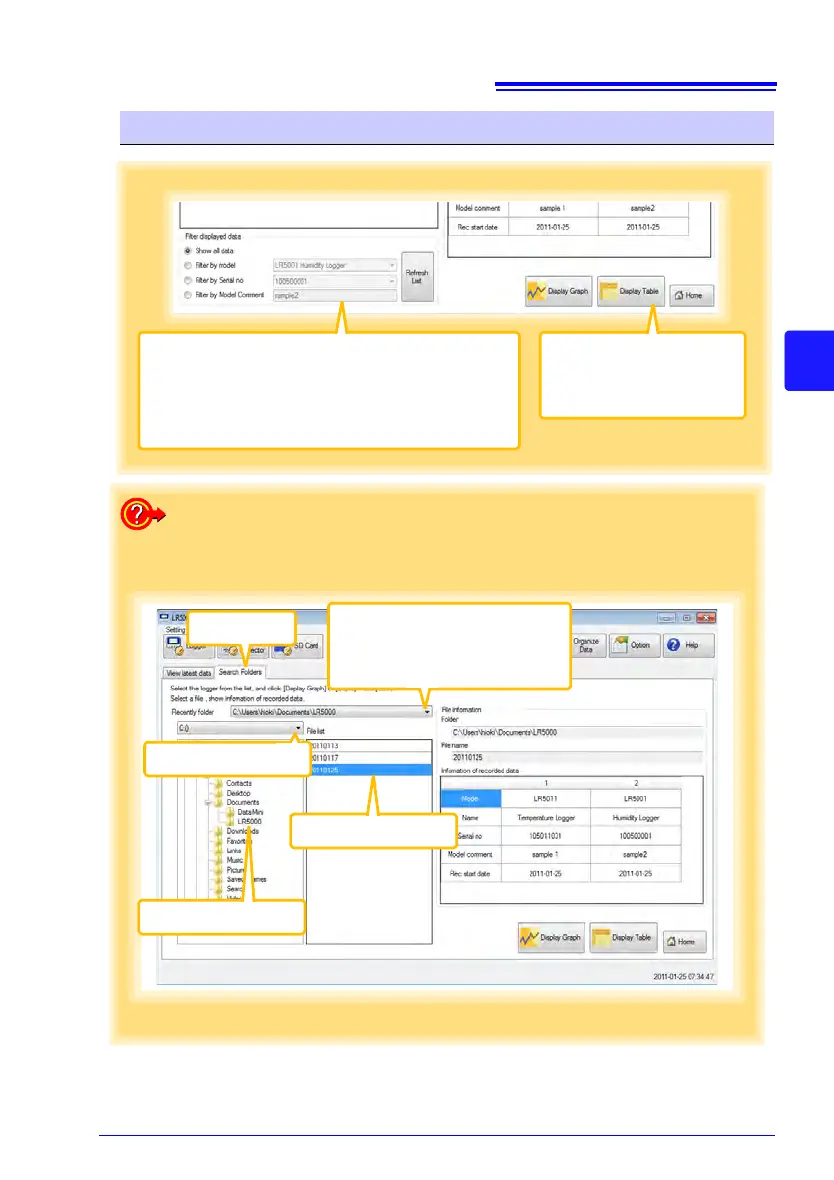
Filter displayed data
You can filter which loggers appear in the list. Specify the
desired filtering criteria, and click the [Refresh List] button.
Note: You can enter up to 20 characters for [Filter by Mod-
el Comment].
Display Table
Opens the viewer to display the
table of imported (or selected)
data.
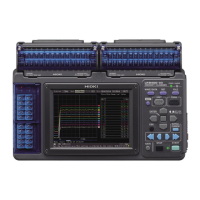
How can past data be viewed?
On the [Search Folders] tab, select the folder and file name to display.
Recently folder
The last ten folders containing data
that was displayed as a graph or ta-
ble are listed.
Select the drive
2
Select the folder
3
Select the file
4
Click
1