Click to select.
The currently selected logger’s
background is a different color.
2
3
Information about the latest data
1
1
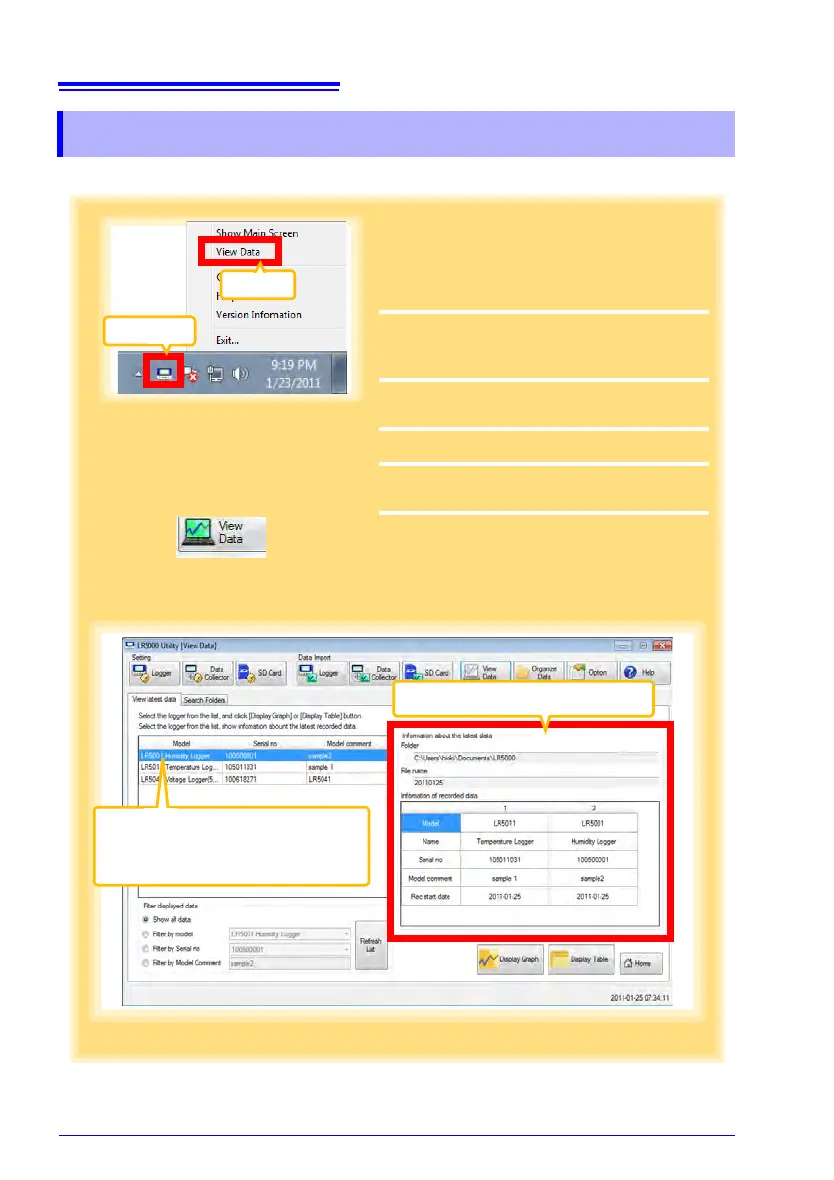
If the LR5000 Utility Program is not run-
ning on the computer, click the icon in the
task tray (notification area), and click
[View Data].
The Data View screen appears.
The
[View latest data] tab shows a list of the
loggers with data saved on the computer.
2
Select the logger from the list.
Information about the latest data appears.
3
Click the [Graph Display] button.
The viewer opens to display the graph (p.47).
If there are more than 16 items to display, the
display item selection screen appears. Select
the items to be displayed in the graph (p.54).
Note: If the LR5000 Utility Program is
running, click [View Data] on the
main screen.
Click
Click