4.5 Automatically Importing (Saving) Recorded Data to a Computer, and Graph Display
47
3
4
Chapter 4 Measurement and Analysis
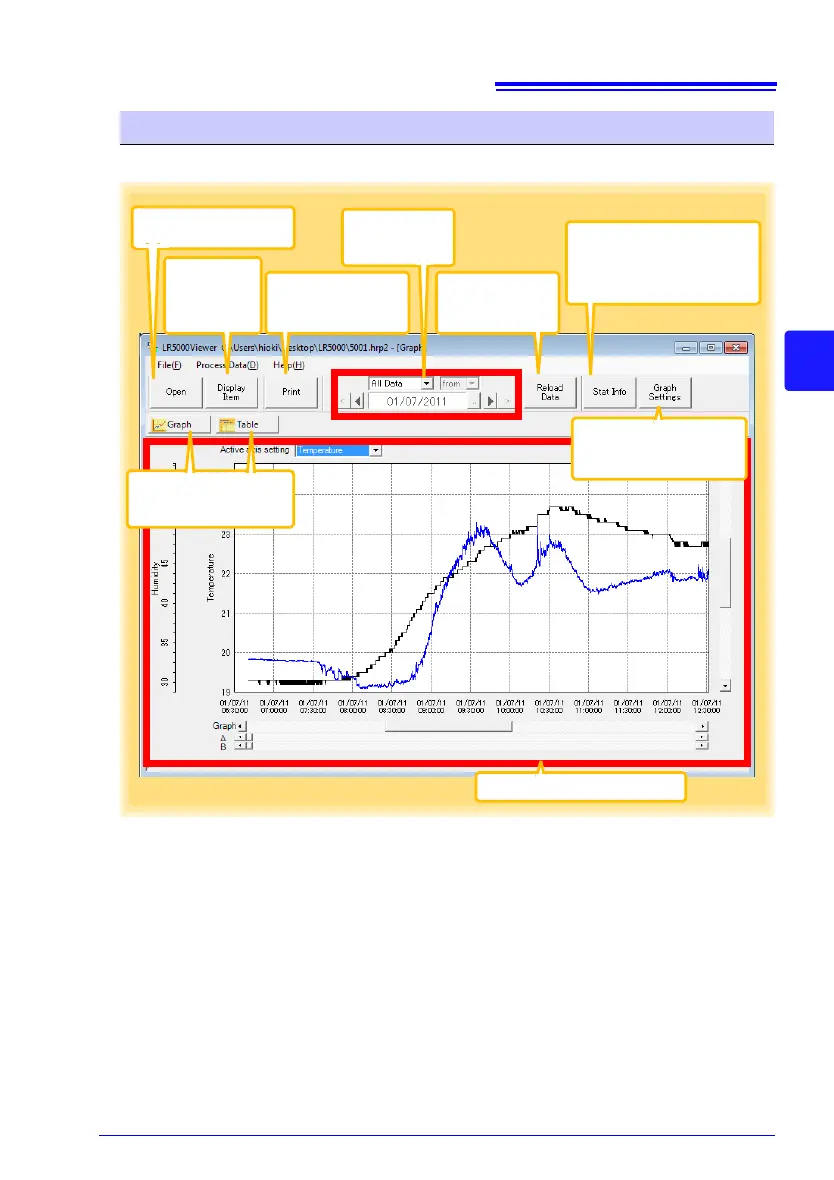
The viewer screen appears as follows.
Viewer Screen
Items to be
displayed are
selectable.
(p.54)
Displayed graphs
and tables can be
printed. (p.60)
The displayed
time span can
be specified.
Reloads and re-
freshes recorded
data from a file.
Displays the [Statistical In-
formation and Item Set-
tings] dialog box when a
graph is displayed. (p.52)
Click the buttons to
switch between graph
and table displays.
Displays the [Graph Set-
tings] dialog box when a
graph is displayed. (p.50)
The graph or table is displayed.
See: "Menu Bar Items" (p.54)
Opens a file containing
recorded data.