4.5 Automatically Importing (Saving) Recorded Data to a Computer, and Graph Display
52
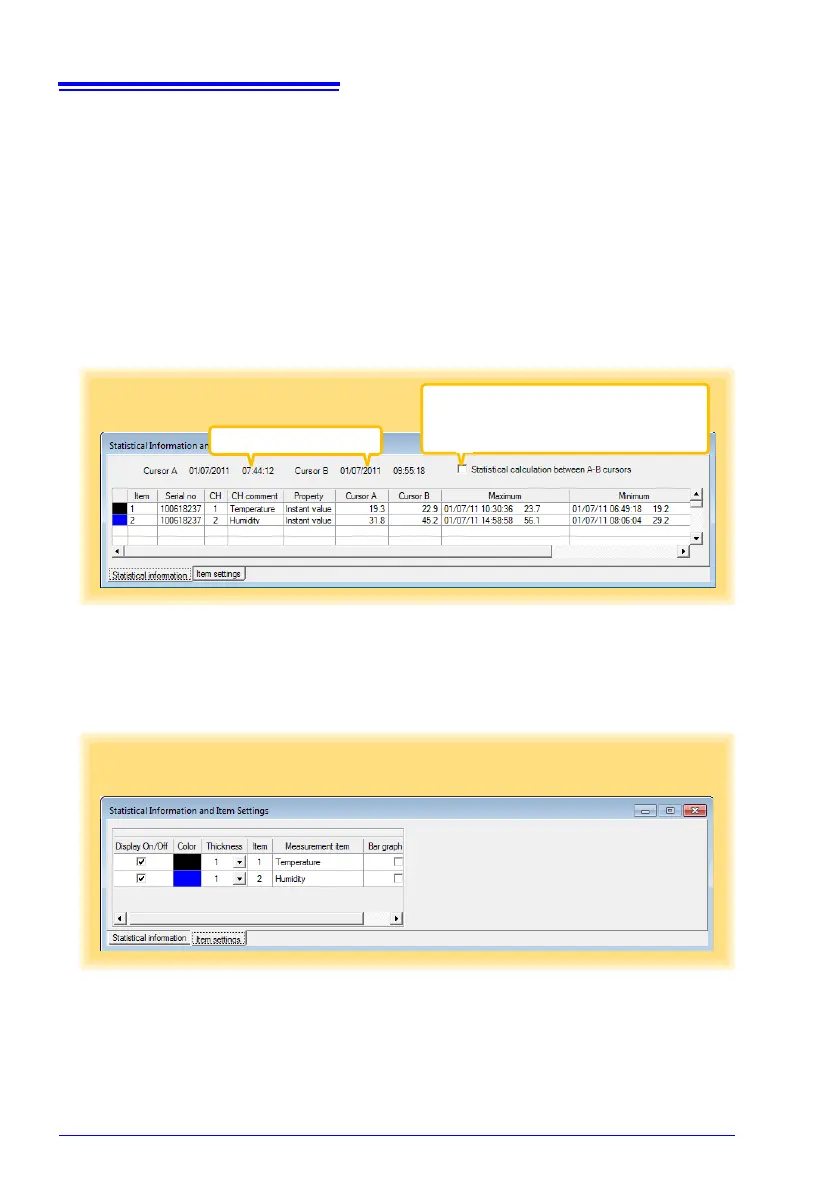
[Statistical Information and Item Settings] dialog box
The following items appear on the [Statistical information] tab.
• Item no.
• Serial no.
• Channel no.
• Channel comments
• Property (Type of measurement value)
• Measured values at A/B cursors
• Statistical data
•Units
The following items appear on the [Ite
m settings] tab.
• Display on/off
• Graph line colors and thickness
• Bar graph display on/off
[Statistical information] tab
Times at A/B cursors
Select to calculate and display maximum,
minimum, average, and integration values
between A/B cursors. Integration values are
displayed only for integrable items.
 Loading...