4.5 Automatically Importing (Saving) Recorded Data to a Computer, and Graph Display
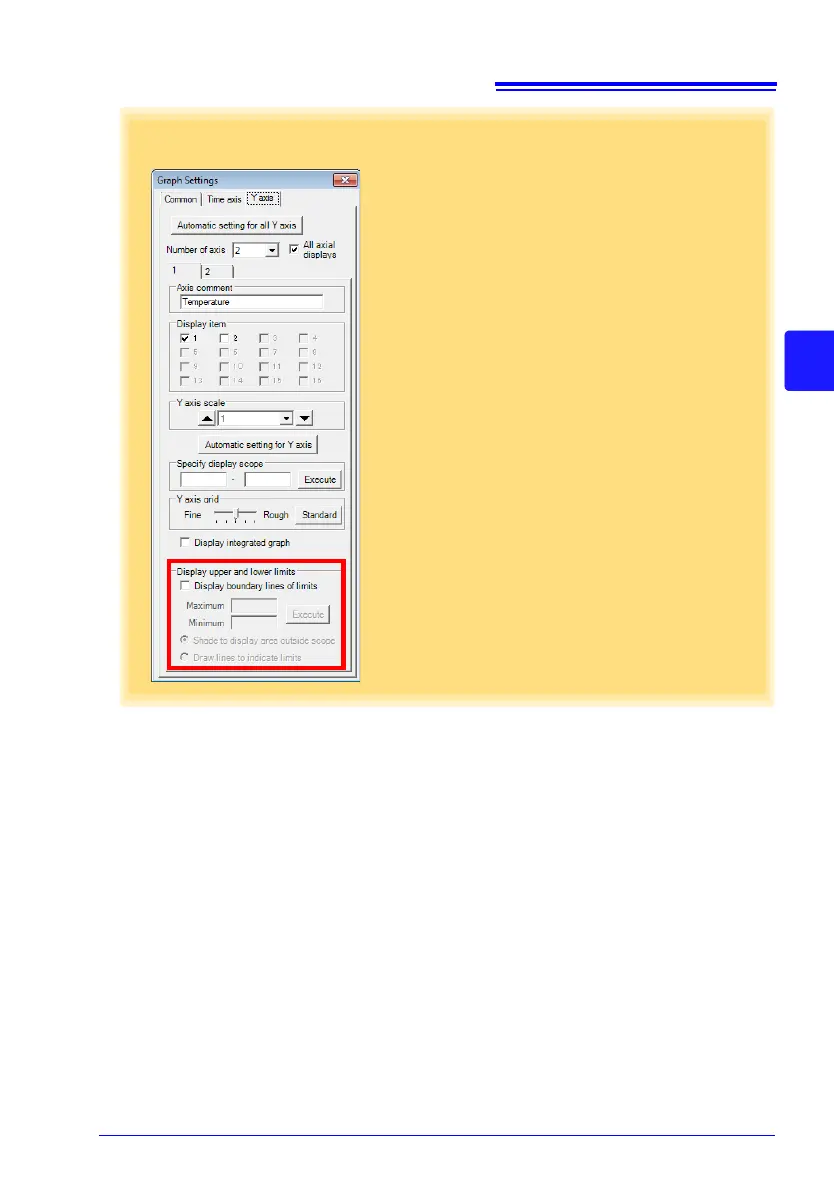
[Y axis] tab
1
Automatically sets all Y-axes to the opti-
mum scale.
2
When the Y-axis is different for each item,
set the number of axes to a value other
than one. The axes can be set to the
number of displayed items (up to 16).
3
Displays all axes.
4
A comment can be entered for each axis.
5
Select the item assigned to each axis.
6
Sets the Y-axis scale for each axis.
7
Automatically sets the currently selected
Y-axis to the optimum scale.
8
Specifies the display span on the Y-axis.
Click [Execute] to apply the settings.
9
Sets the Y-axis grid spacing.
10
Display the items selected in [Display
item] on an integrated graph.
11
Upper and lower thresholds can be dis-
played as solid lines on the graph, or out-
of-range areas can be filled with a solid
color.
1
2
4
5
6
7
3
8
9
11
10