4.5 Automatically Importing (Saving) Recorded Data to a Computer, and Graph Display
50
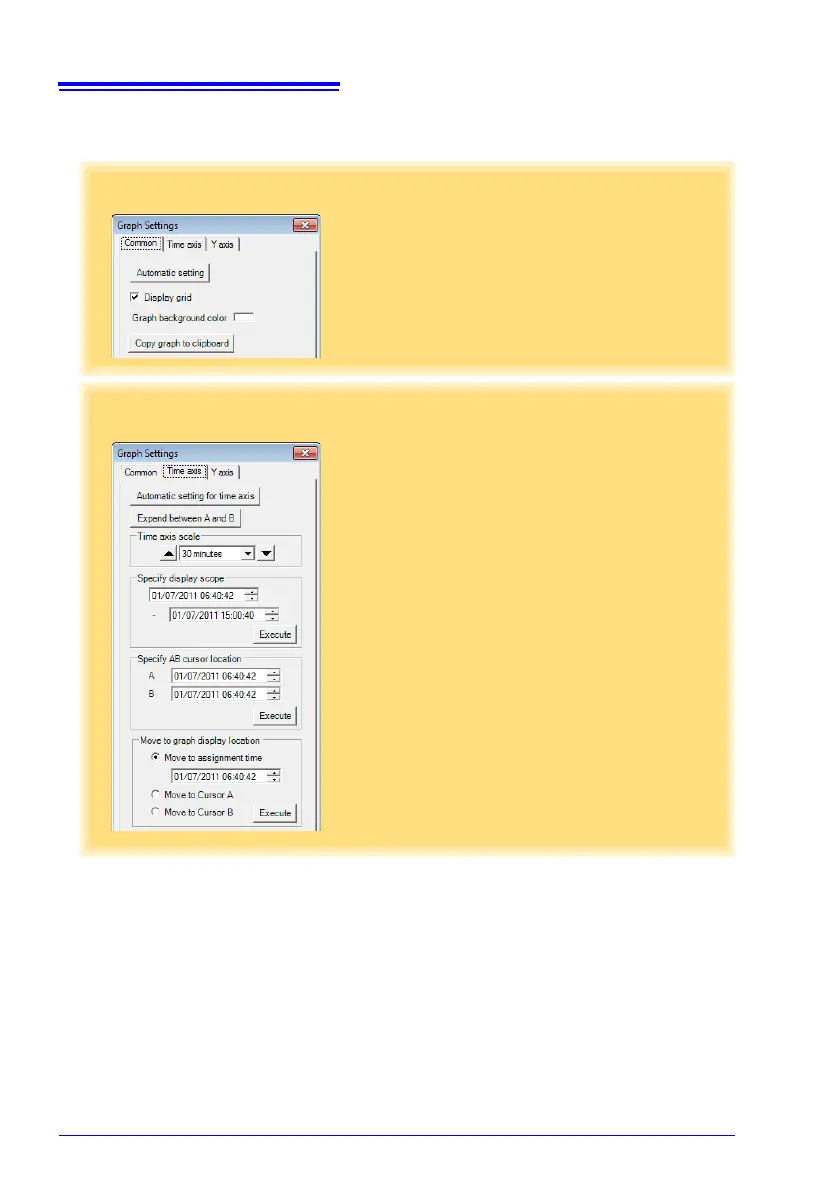
[Graph Settings] dialog box
Graph details can be set as follows. Click each tab to access various settings.
[Common] tab
1
Automatically sets the time axis and Y-
axis to the optimum scale.
2
Select to display the grid.
3
Changes the graph background color.
4
Copies the graph to the clipboard. The
graph can then be pasted into Microsoft
Word etc.
1
2
3
4
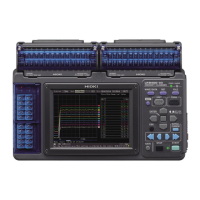
[Time axis] tab
1
Automatically sets the time axis to the
optimum scale.
2
Zooms the display to show only the time
span between A/B cursors.
3
Changes the time base scale.
4
Specifies the displayed time span on the
time axis. Click [Execute] to apply the
settings.
5
Specifies cursor positions. Click [Exe-
cute] to apply the settings.
6
Specifies the graph start position (time).
Click [Execute] to apply the settings.
1
2
3
4
5
6