4.5 Automatically Importing (Saving) Recorded Data to a Computer, and Graph Display
49
3
4
Chapter 4 Measurement and Analysis
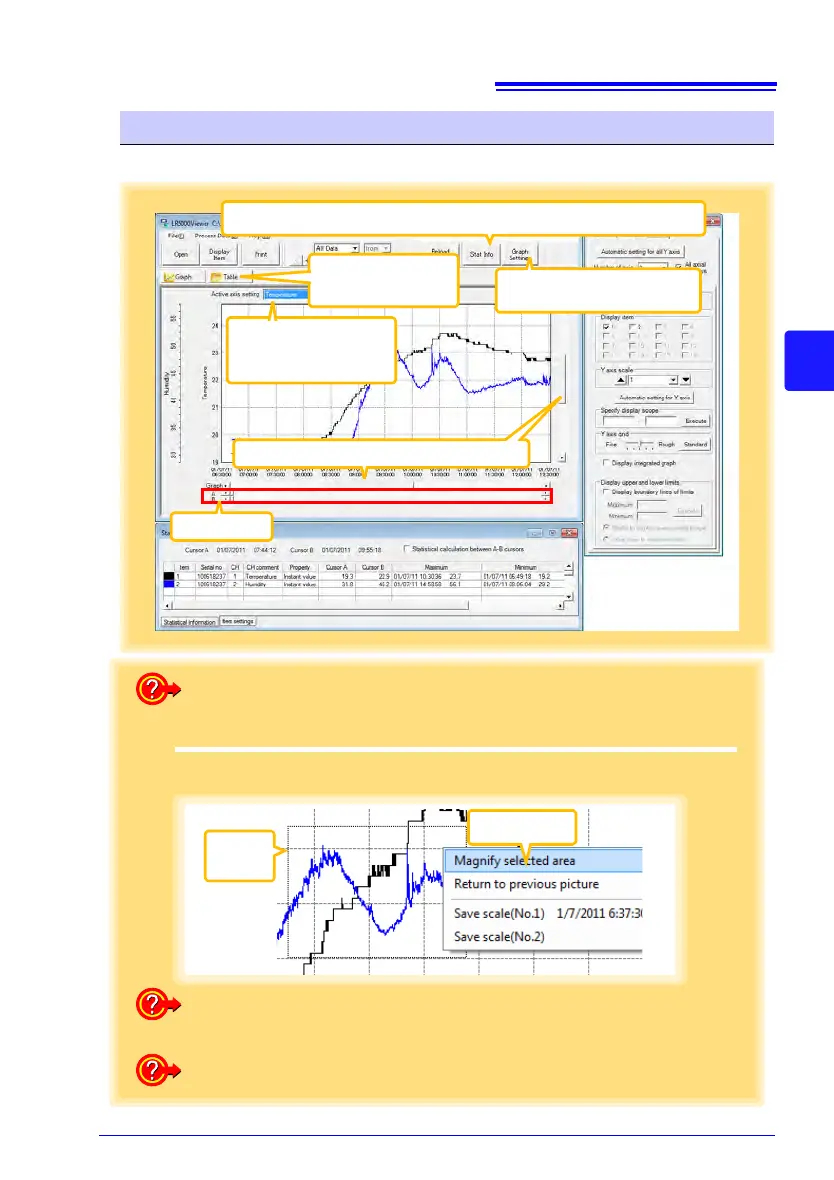
The main graph features are shown below.
Main Graph Features
Displays the [Statistical Information and Item Settings] dialog box. (p.52)
Displays the [Graph Settings]
dialog box. (p.50)
A/B cursors
Scroll Bar (scrolls the graph)
When there are two or
more axes, select the
one displayed closest to
the graph.
Click the buttons to
switch between graph
and table displays.
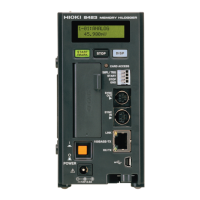
How can the displayed area be magnified?
Dotted
Box
Click
2
1
Drag over the area to be enlarged to enclose it in a dotted box.
2
Right click to open the pop-up menu, and click [Magnify selected area].
How can graph details be set?
Detailed settings are available in the [Graph Settings] dialog box. (p.50)
How can graph line color and display be switched?
Change settings on the [Item settings] tab in the [Statistical Information and
Item Settings] dialog box (p.52)