90
Making Measurements
Measuring Wander
6 Press to start the measurement.
HOW TO: View the Results
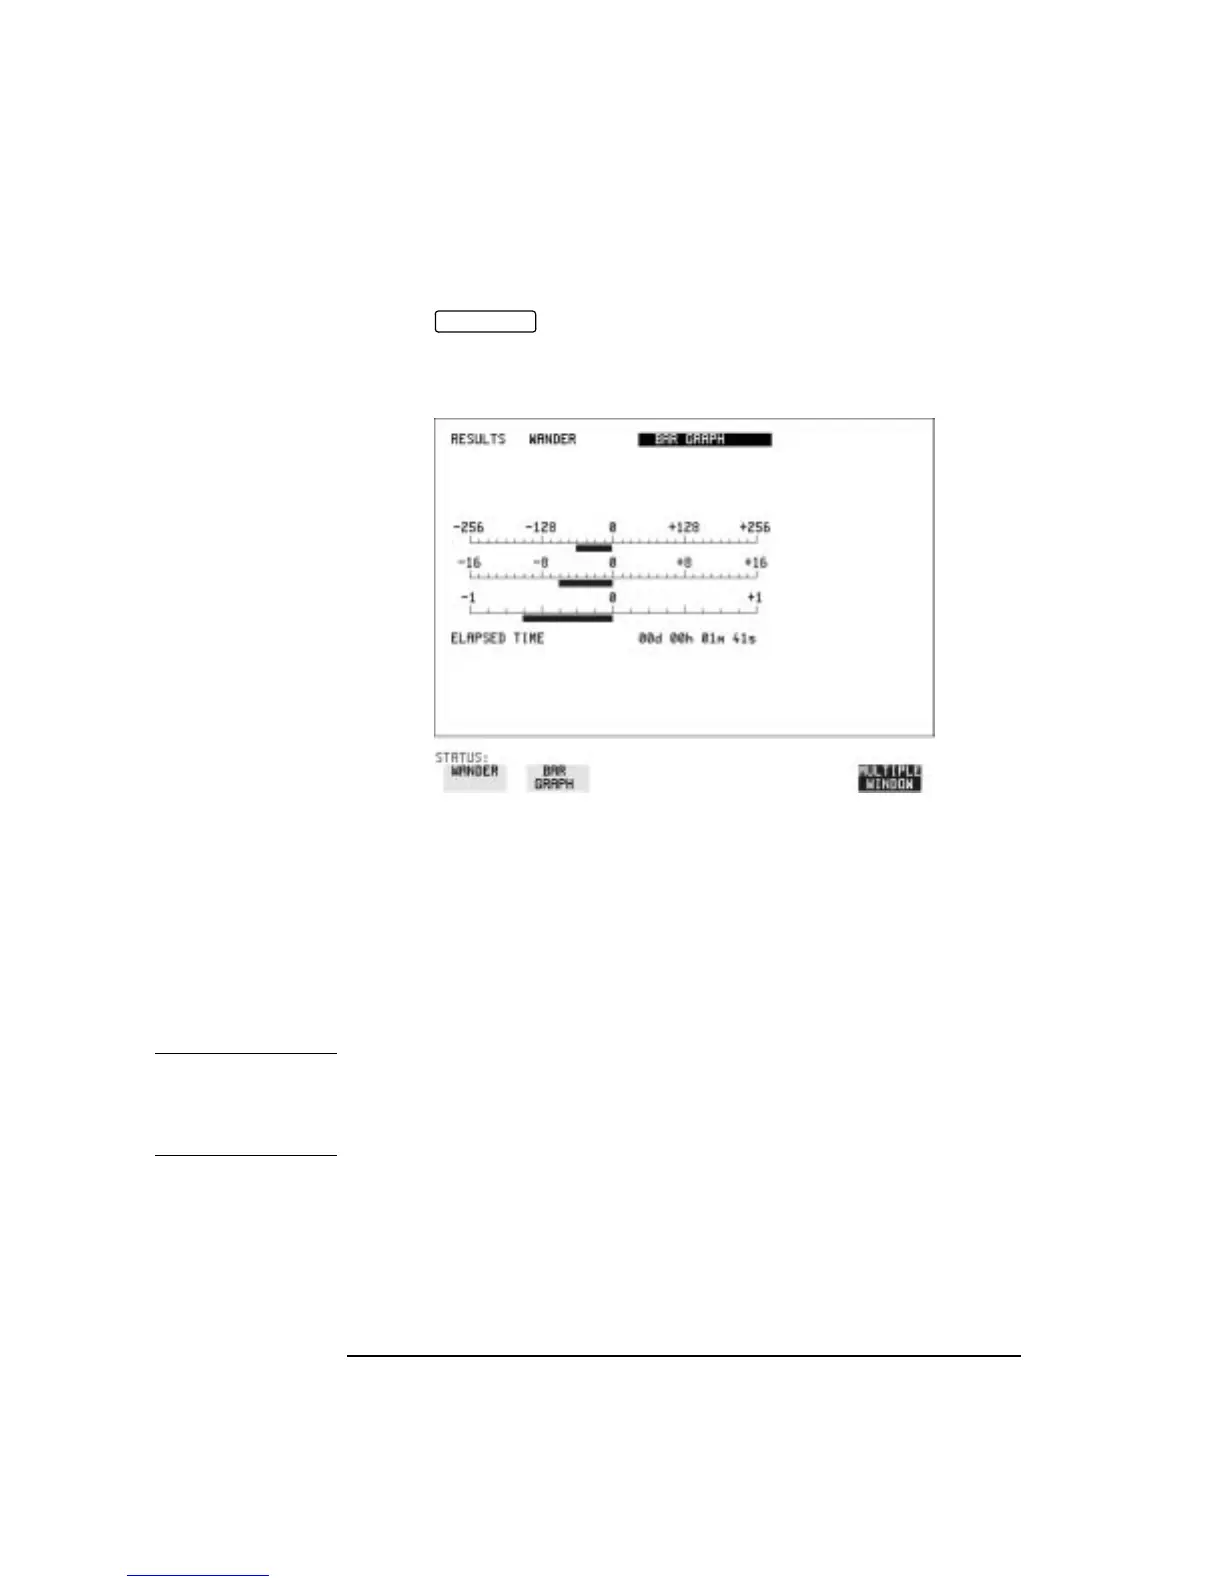
1 Choose the results type, WANDER or BAR GRAPH.
If Bar Graph is chosen the cumulative wander results are displayed in
graphical form. The Bar Graphs are additive and in the example
shown above the Wander is -70.625 BITS.
2 If WANDER is chosen, choose the units in which the results are
displayed.
TIME displays the wander results in microseconds.
BITS displays the wander results in bits.
NOTE Estimated Bit Slips signify the slippage from the start of the
measurement.
One Estimated Frame Slip corresponds to 256 Bit Slips.
Implied Frequency Offset is calculated from the Wander results.
RUN/STOP
Artisan Technology Group - Quality Instrumentation ... Guaranteed | (888) 88-SOURCE | www.artisantg.com