Page 12-39
• Press @ERASE @DRAW to see the surface plot. This time the bulk of the plot is
located towards the right –hand side of the display.
• Press @CANCL to return to the PLOT WINDOW environment.
• Press $ , or L@@@OK@@@, to return to normal calculator display.
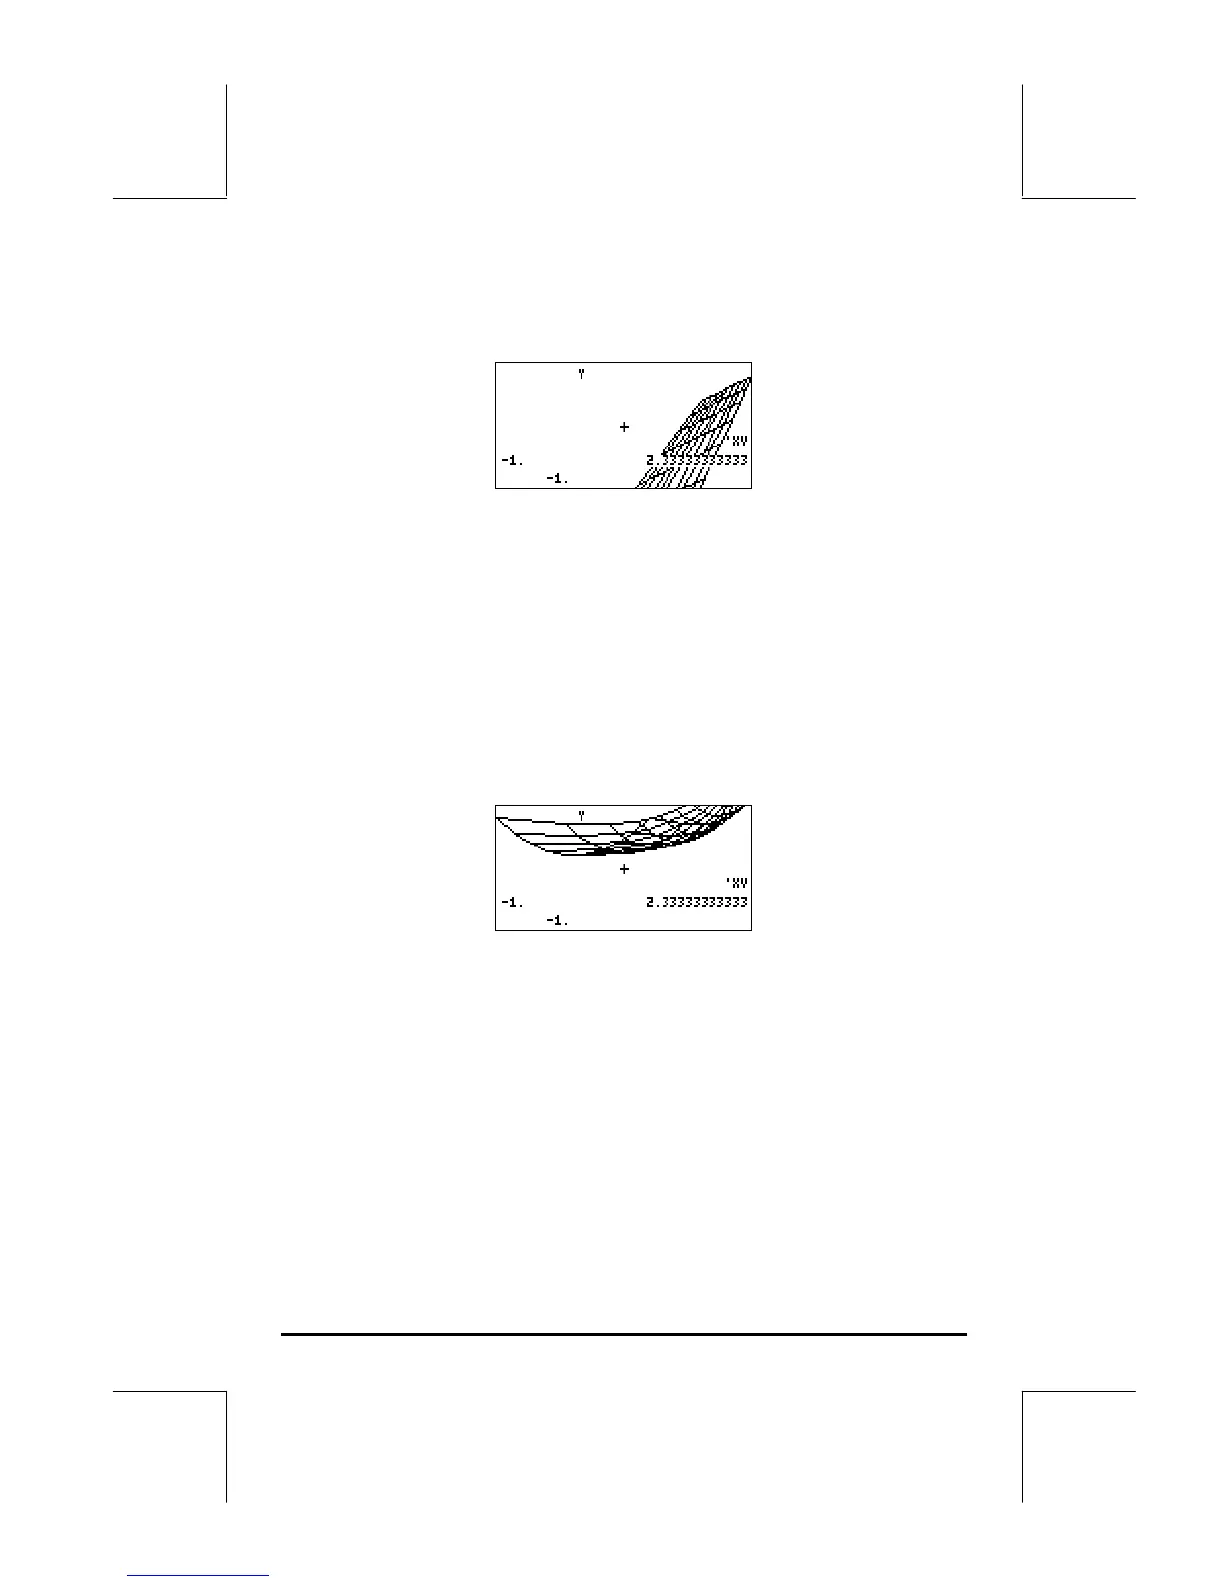
Try also a Wireframe plot for the surface z = f(x,y) = x
2
+y
2
• Press „ô, simultaneously if in RPN mode, to access the PLOT SETUP
window.
• Press ˜ and type ‘X^2+Y^2’ @@@OK@@@.
• Press @ERASE @DRAW to draw the slope field plot. Press @EDIT L@)MENU @LABEL
to see the plot unencumbered by the menu and with identifying labels.
• Press LL@)PICT to leave the EDIT environment.
• Press @CANCL to return to the PLOT WINDOW environment. Then, press
$ , or L@@@OK@@@, to return to normal calculator display.
Ps-Contour plots
Ps-Contour plots are contour plots of three-dimensional surfaces described by
z = f(x,y). The contours produced are projections of level surfaces z =
constant on the x-y plane. For example, to produce a Ps-Contour plot for the
surface z = x
2
+y
2
, use the following:
 Loading...


