Page 22-33
An example of a program using GROB
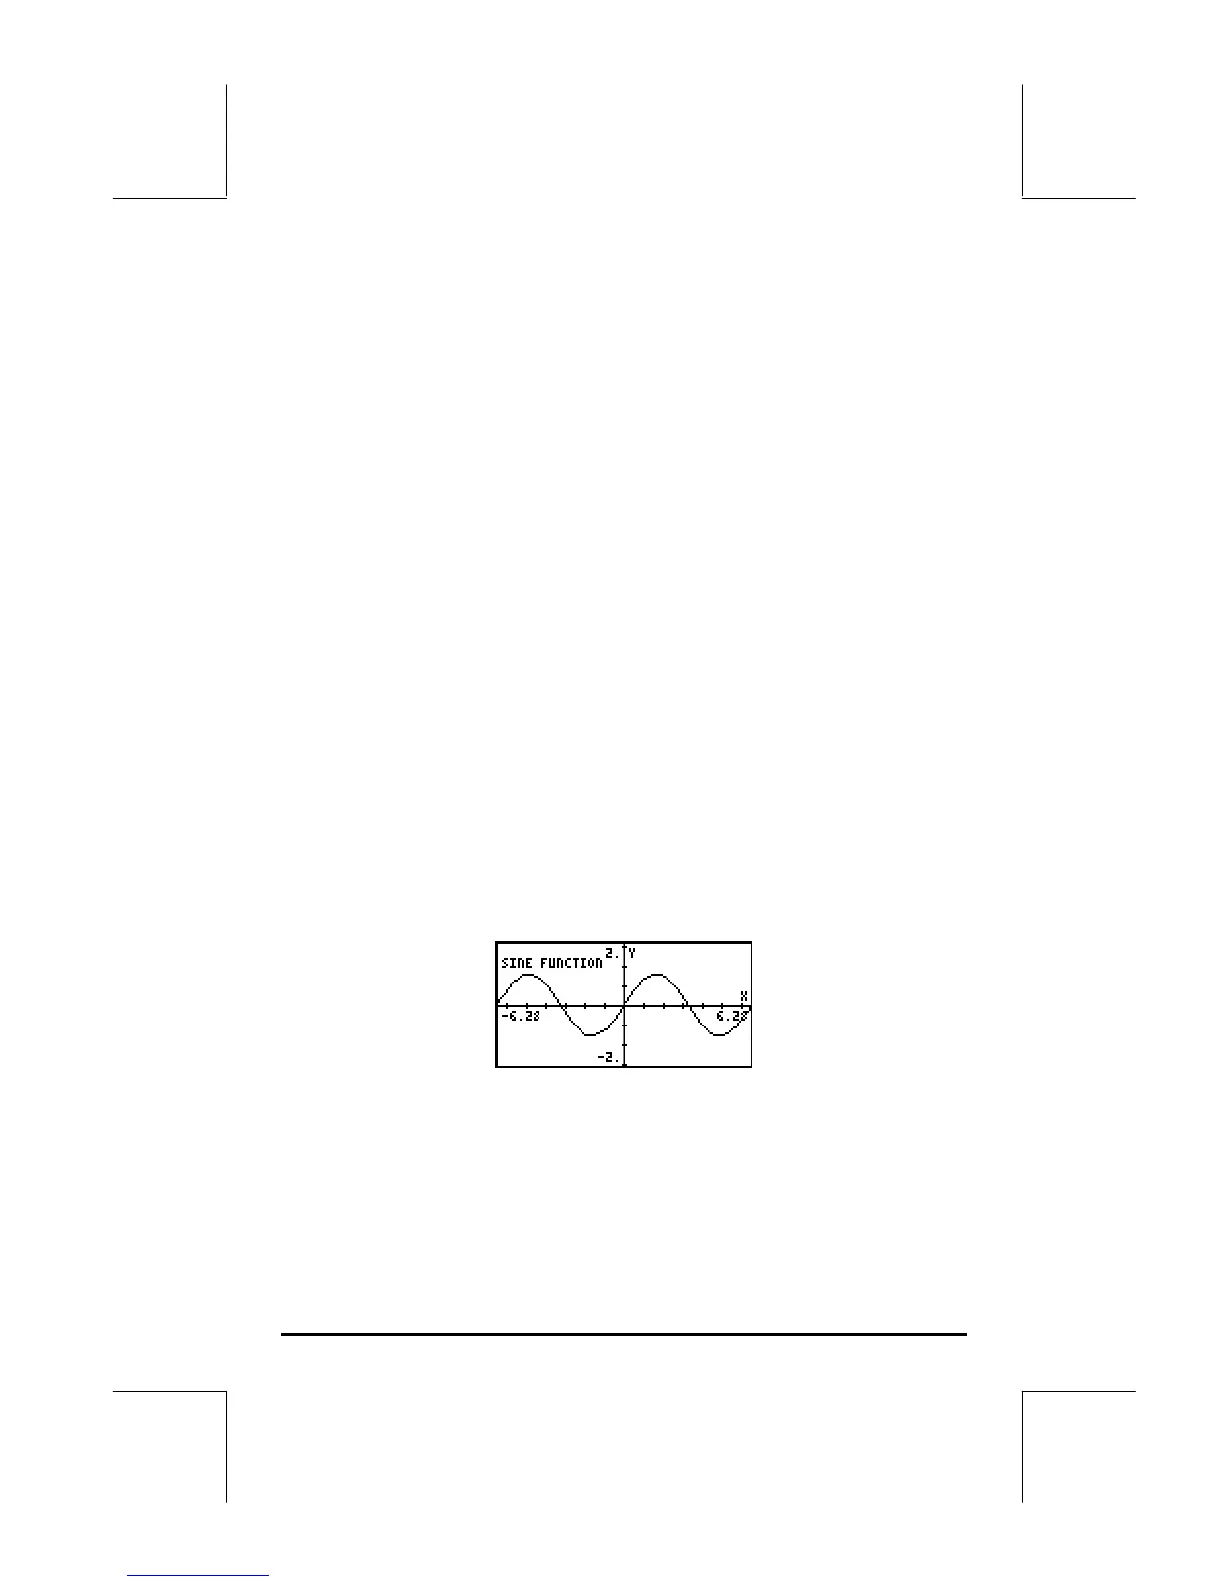
The following program produces the graph of the sine function including a
frame – drawn with the function BOX – and a GROB to label the graph.
Here is the listing of the program:
« Begin program
RAD Set angle units to radians
131 RB 64 RB PDIM Set PICT screen to 131×64 pixels
-6.28 6.28 XRNG –2. 2. YRNG Set x- and y-ranges
FUNCTION Select FUNCTION type for graphs
‘SIN(X)’ STEQ Store the function sine into EQ
ERASE DRAX LABEL DRAW Clear, draw axes, labels, graph
(-6.28,-2.) (6.28,2.) BOX Draw a frame around the graph
PICT RCL Place contents of PICT on stack
“SINE FUNCTION” Place graph label string in stack
1 GROB Convert string into a small GROB
(-6., 1.5) SWAP Coordinates to place label GROB
GOR Combine PICT with the label GROB
PICT STO Save combined GROB into PICT
{ } PVIEW Bring PICT to the stack
» End program
Save the program under the name GRPR (GROB PRogram). Press @GRPR to run
the program. The output will look like this:
A program with plotting and drawing functions
In this section we develop a program to produce, draw and label Mohr’s
circle for a given condition of two-dimensional stress. The left-hand side
figure below shows the given state of stress in two-dimensions, with σ
xx
and
σ
yy
being normal stresses, and τ
xy
= τ
yx
being shear stresses. The right-hand
 Loading...


