Page 16-63
• Also, use the following values for the remaining parameters: Init: 0, Final:
5, Step: Default, Tol: 0.0001, Init-Soln: 0
• To plot the graph use: @ERASE @DRAW
When you observe the graph being plotted, you'll notice that the graph is not
very smooth. That is because the plotter is using a time step that may be a bit
large for a smooth graph. To refine the graph and make it smoother, use a
step of 0.1. Press @CANCL and change the Step : value to 0.1, then use
@ERASE @DRAW once more to repeat the graph. The plot will take longer to be
completed, but the shape is definitely smoother than before. Try the following:
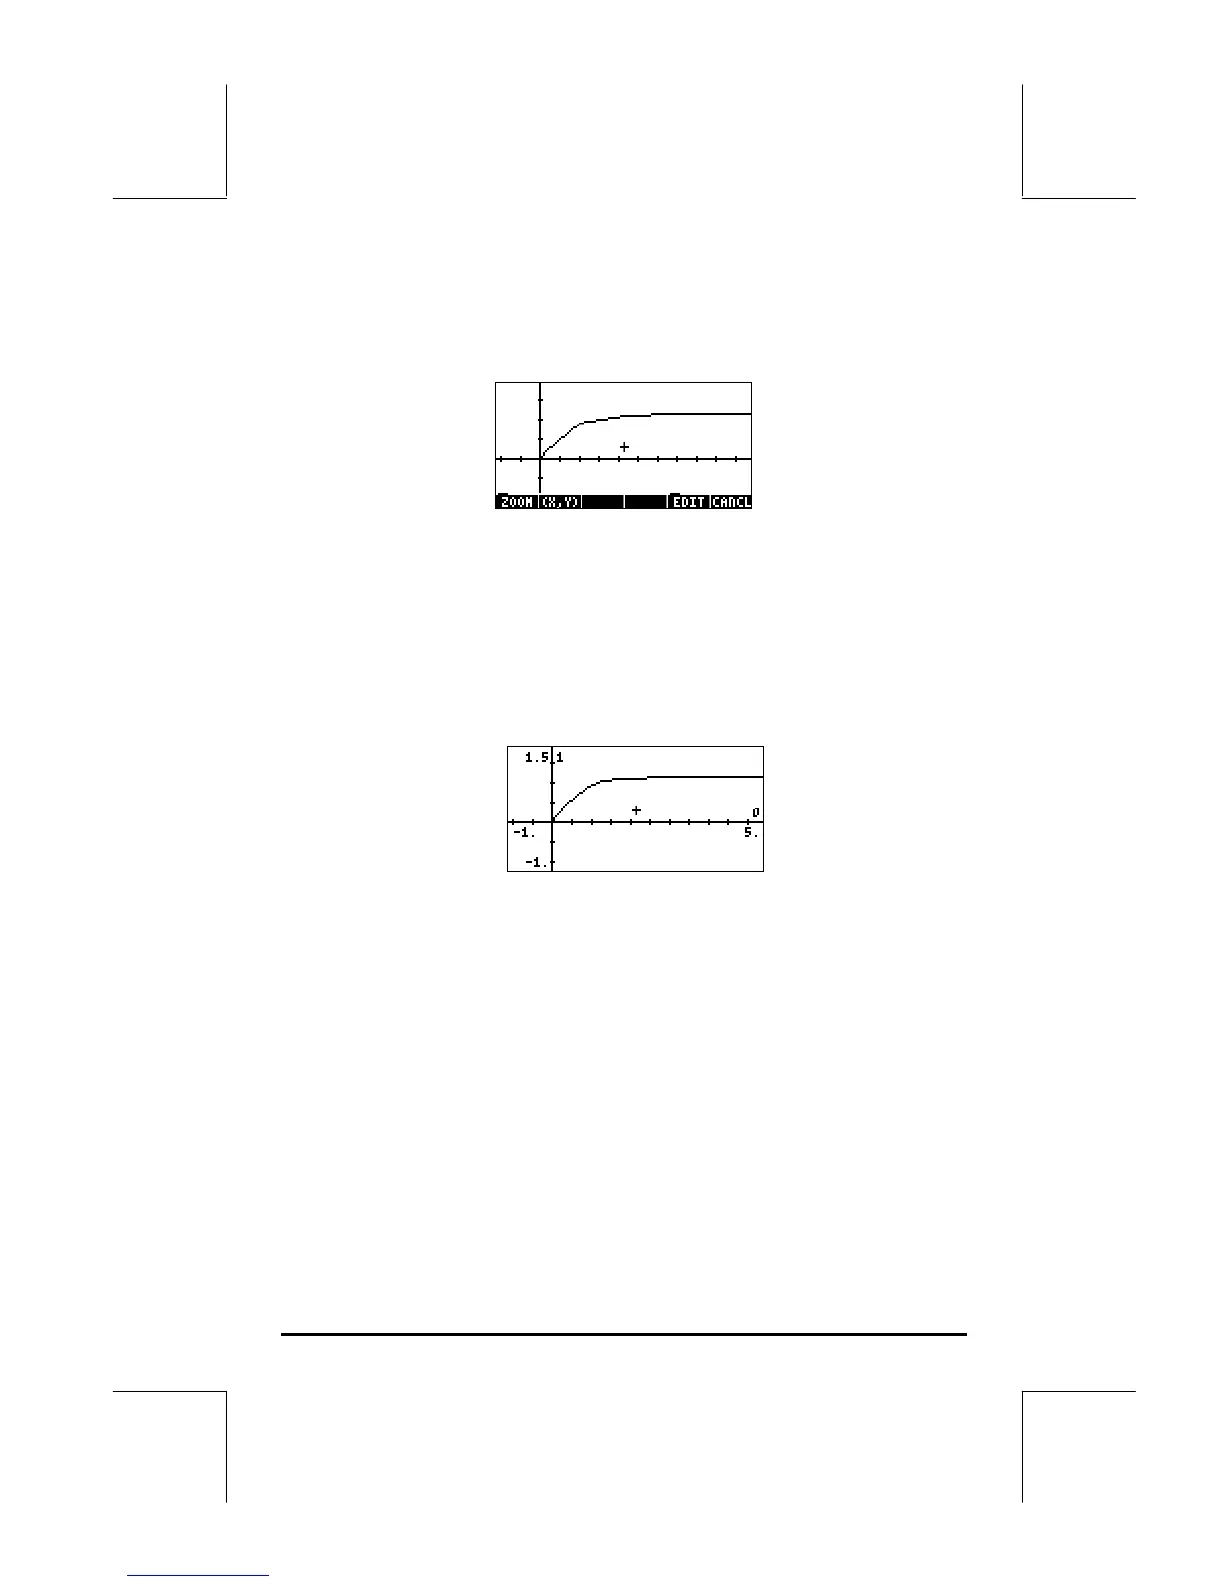
@EDIT L @LABEL @MENU to see axes labels and range.
Notice that the labels for the axes are shown as 0 (horizontal, for t) and 1
(vertical, for x). These are the definitions for the axes as given in the PLOT
SETUP window („ô) i.e., H-VAR: 0, and V-VAR: 1. To see the graphical
solution in detail use the following:
LL@)PICT To recover menu and return to PICT environment.
@(X,Y)@ To determine coordinates of any point on the graph.
Use the š™ keys to move the cursor around the plot area. At the bottom
of the screen you will see the coordinates of the cursor as (X,Y), i.e., the
calculator uses X and Y as the default names for the horizontal and vertical
axes, respectively. Press L@CANCL to recover the menu and return to the
PLOT WINDOW environment. Finally, press $ to return to normal display.
 Loading...


