Page 18-29
The result indicates that a 95% confidence interval has been calculated. The
Critical z value shown in the screen above corresponds to the values ±z
α/2
in
the confidence interval formula (X−z
α
/2
⋅σ/√n , X+z
α
/2
⋅σ/√n ). The values µ
Min and µ Max are the lower and upper limits of this interval, i.e., µ Min =
X−z
α
/2
⋅σ/√n, and µ Max = X+z
α
/2
⋅σ/√n.
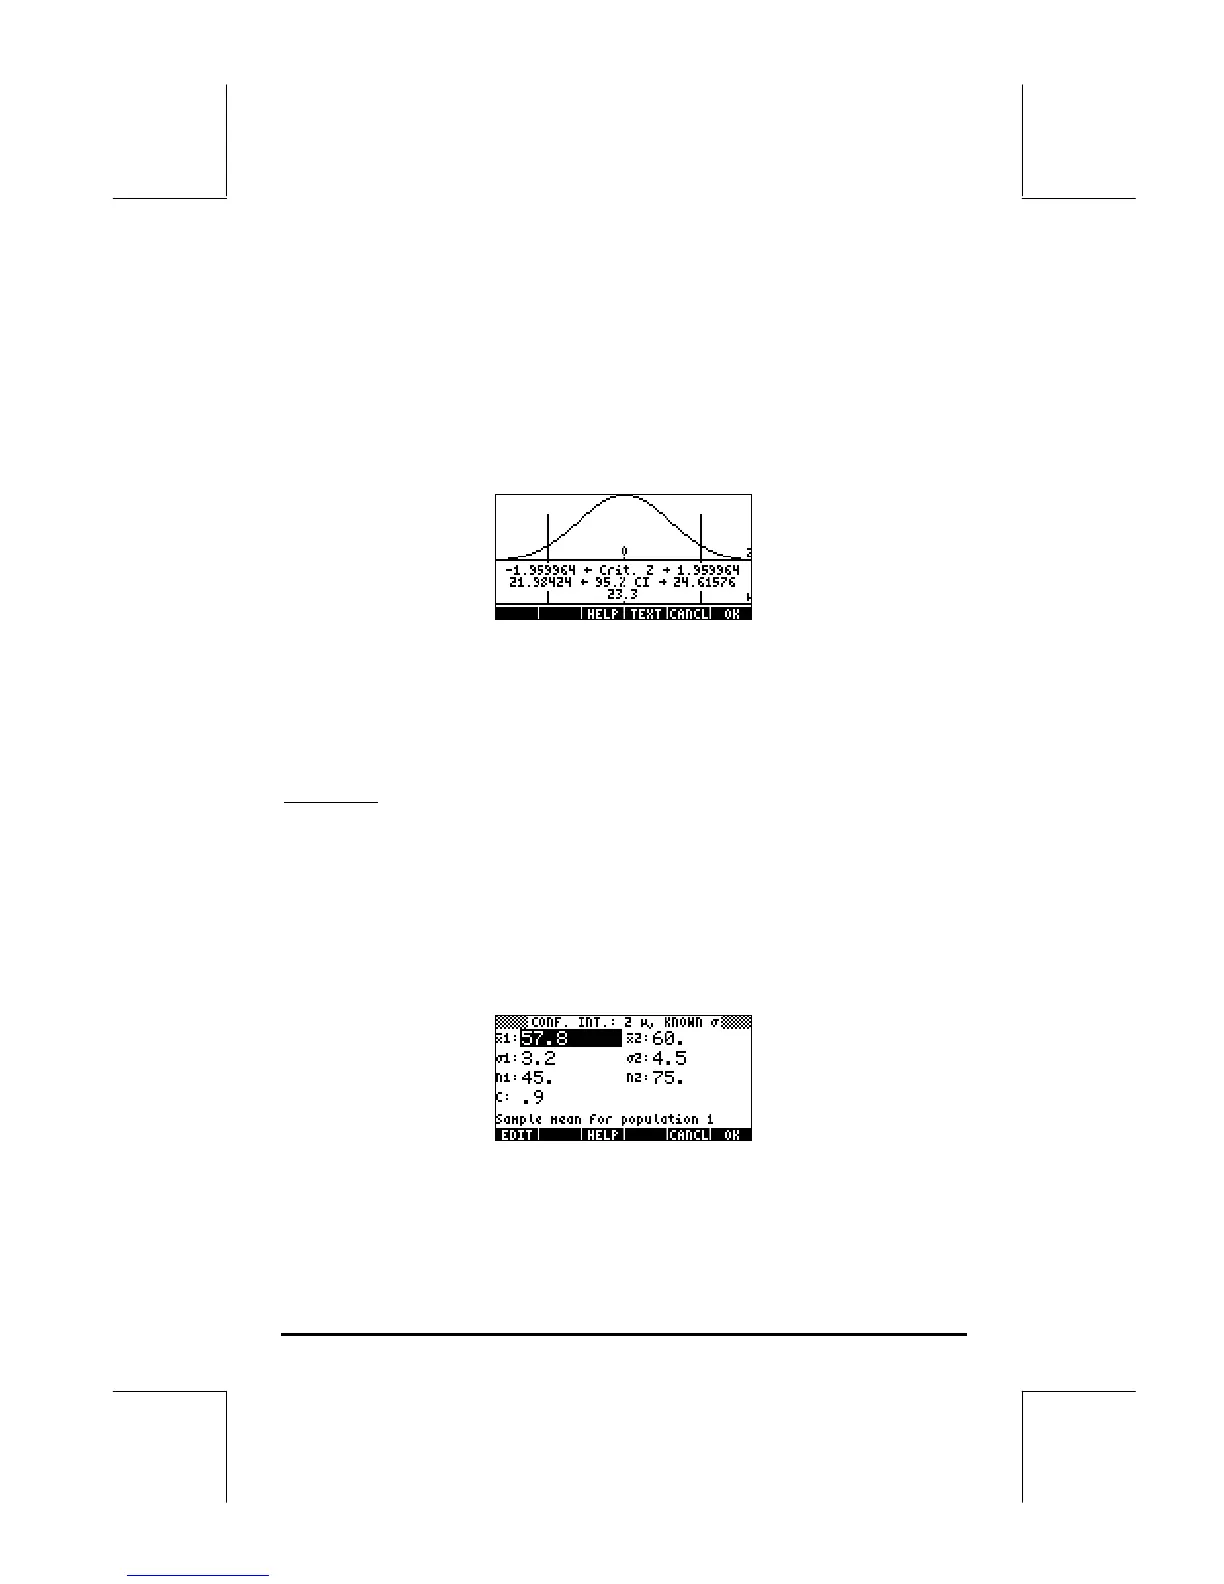
Press @GRAPH to see a graphical display of the confidence interval information:
The graph shows the standard normal distribution pdf (probability density
function), the location of the critical points ±z
α/2
, the mean value (23.2) and
the corresponding interval limits (21.88424 and 24.51576). Press @TEXT to
return to the previous results screen, and/or press @@@OK@@@ to exit the confidence
interval environment. The results will be listed in the calculator’s display.
Example 2
-- Data from two samples (samples 1 and 2) indicate that x
1
=
57.8 and x
2
= 60.0. The sample sizes are n
1
= 45 and n
2
= 75. If it is
known that the populations’ standard deviations are σ
1
= 3.2, and σ
2
= 4.5,
determine the 90% confidence interval for the difference of the population
means, i.e., µ
1
- µ
2
.
Press ‚Ù—@@@OK@@@to access the confidence interval feature in the
calculator. Press ˜@@@OK@@@ to select option 2. Z-INT: µ 1 – µ2.. Enter the
following values:
When done, press @@@OK@@@. The results, as text and graph, are shown below:
 Loading...


