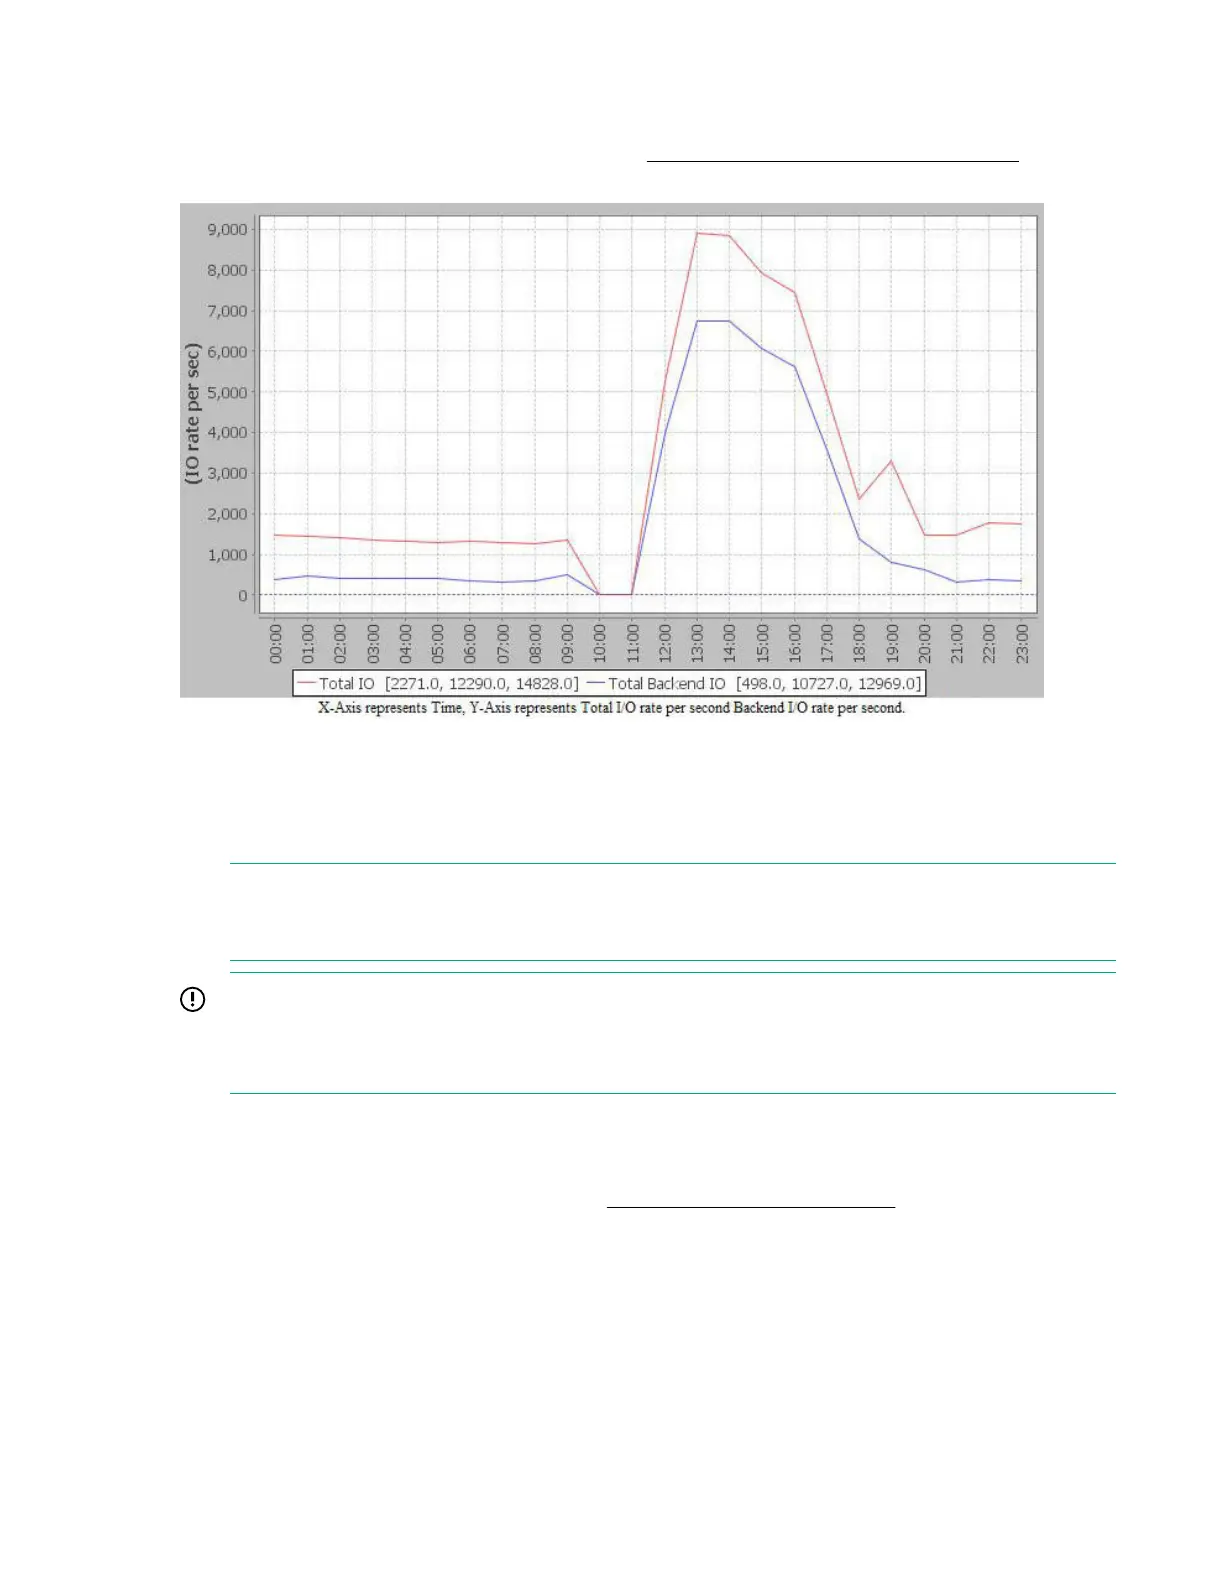
Total I/O Rate by hour of day report
The Total I/O Rate by hour of day report displays in a chart format, the number of total read and write I/O
operations per second over the over 24-hour period. Figure 13: Total I/O Rate by hour of day on page
306 displays a sample Total I/O Rate by hour of day report for a P9500 Disk Array.
Figure 13: Total I/O Rate by hour of day
The total backend transfers may be compared to the total frontend I/Os and the difference is due to the
effects of the array cache. The total backend transfers load is taken by the RAID Groups and ACP/DKA
pairs, where as the total frontend I/O load is taken by the CHIP/CHA ports.
NOTE: If there are no data points available for the dates selected, blank chart is displayed. If all the
data values are zero for the dates selected, a chart with a horizontal line along the X axis is
displayed in the center of the chart.
IMPORTANT:
For the Hour of the Day report, all the points collected aggregate to the start of the hour. For
example, if data is collected between 1 p.m. and 2 p.m., the aggregate data is displayed at 1 p.m.
instead of 2 p.m.
Total I/O Rate Detail report
The Total I/O Rate Detail report displays in a chart format, the number of Sequential I/Os, Random I/Os,
and CFW I/O operations, over the entire period. Figure 14: Total I/O Rate Detail on page 307 displays a
sample Total I/O Rate Detail report for a P9500 Disk Array.
306 Total I/O Rate by hour of day report