GSC60
EN - 91
8. The “ ” and “ ” symbols show the Inductive or
Capacitive type of the load, respectively.
Press the SAVE button or touch the icon to save
the measurement on the display as instantaneous
snapshot (see § 7.1)
9.
Touch the icon to access the pages of
absorbed/generated power/energies. The screen like
the one to the side in the condition of recording not
activated is shown
10
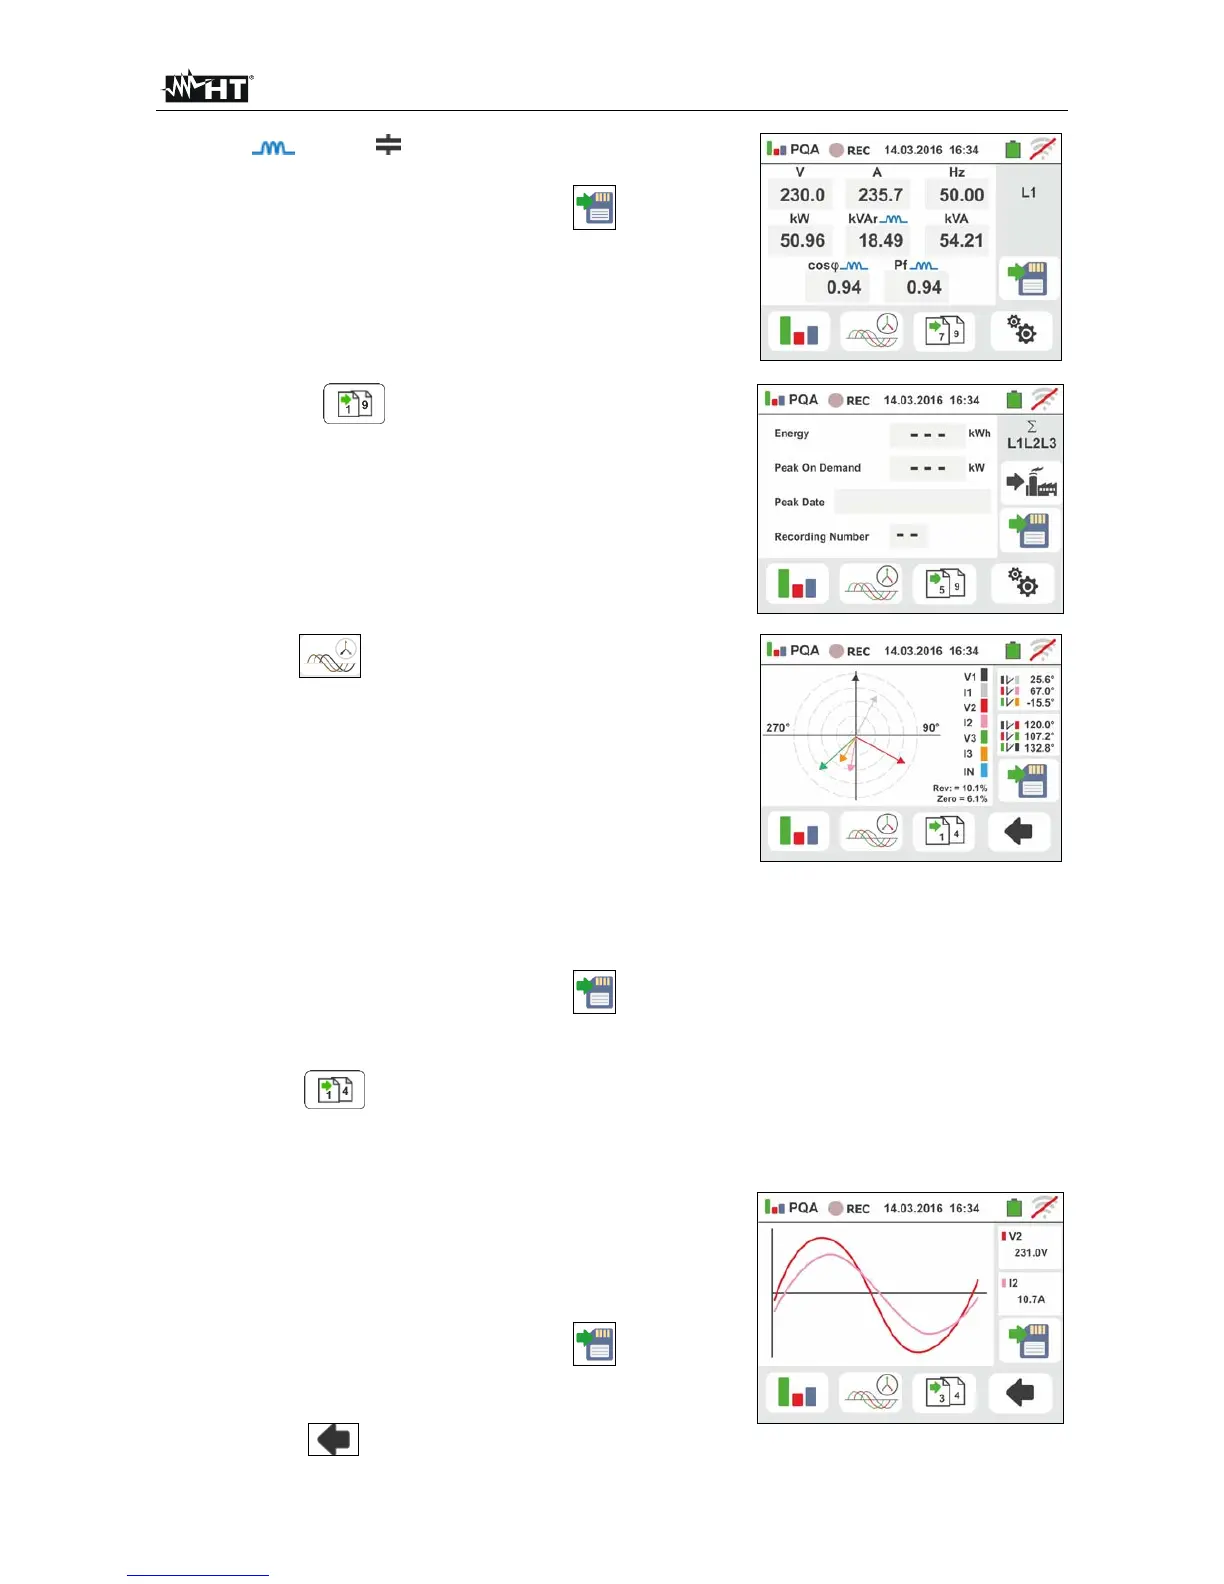
Touch the icon to show the pages of input signal
waveforms and vector diagrams of voltages/currents.
The screen like the one to the side shows the real-time
values of phase angles between voltage and current
relevant to a three-phase system. The parameters are
indicated with small squares in different colors and the
angular values are shown on the right side. The
positive rotation reference associated with each vector
diagram is clockwise.
In the bottom part of the display there are the “Rev” and
“Zero” indications associated with the unbalance of
input voltages (see § 12.14)
Press the SAVE button or touch the
icon to save
the measurement on the display as instantaneous
snapshot (see § 7.1)
Touch the icon to show the signal waveforms.
The following screen (referred to phase L2) is shown on
the display
11 The screen like the one to the side shows the real-time
waveforms of voltage and current relevant to a three-
phase system. The parameters are indicated with small
squares in different colors and the RMS values are
shown on the right side.
Press the SAVE button or touch the icon to save
the measurement on the display as instantaneous
snapshot (see § 7.1).
Touch the icon to go back to the main screen of
RMS values