GSC60
EN - 92
12
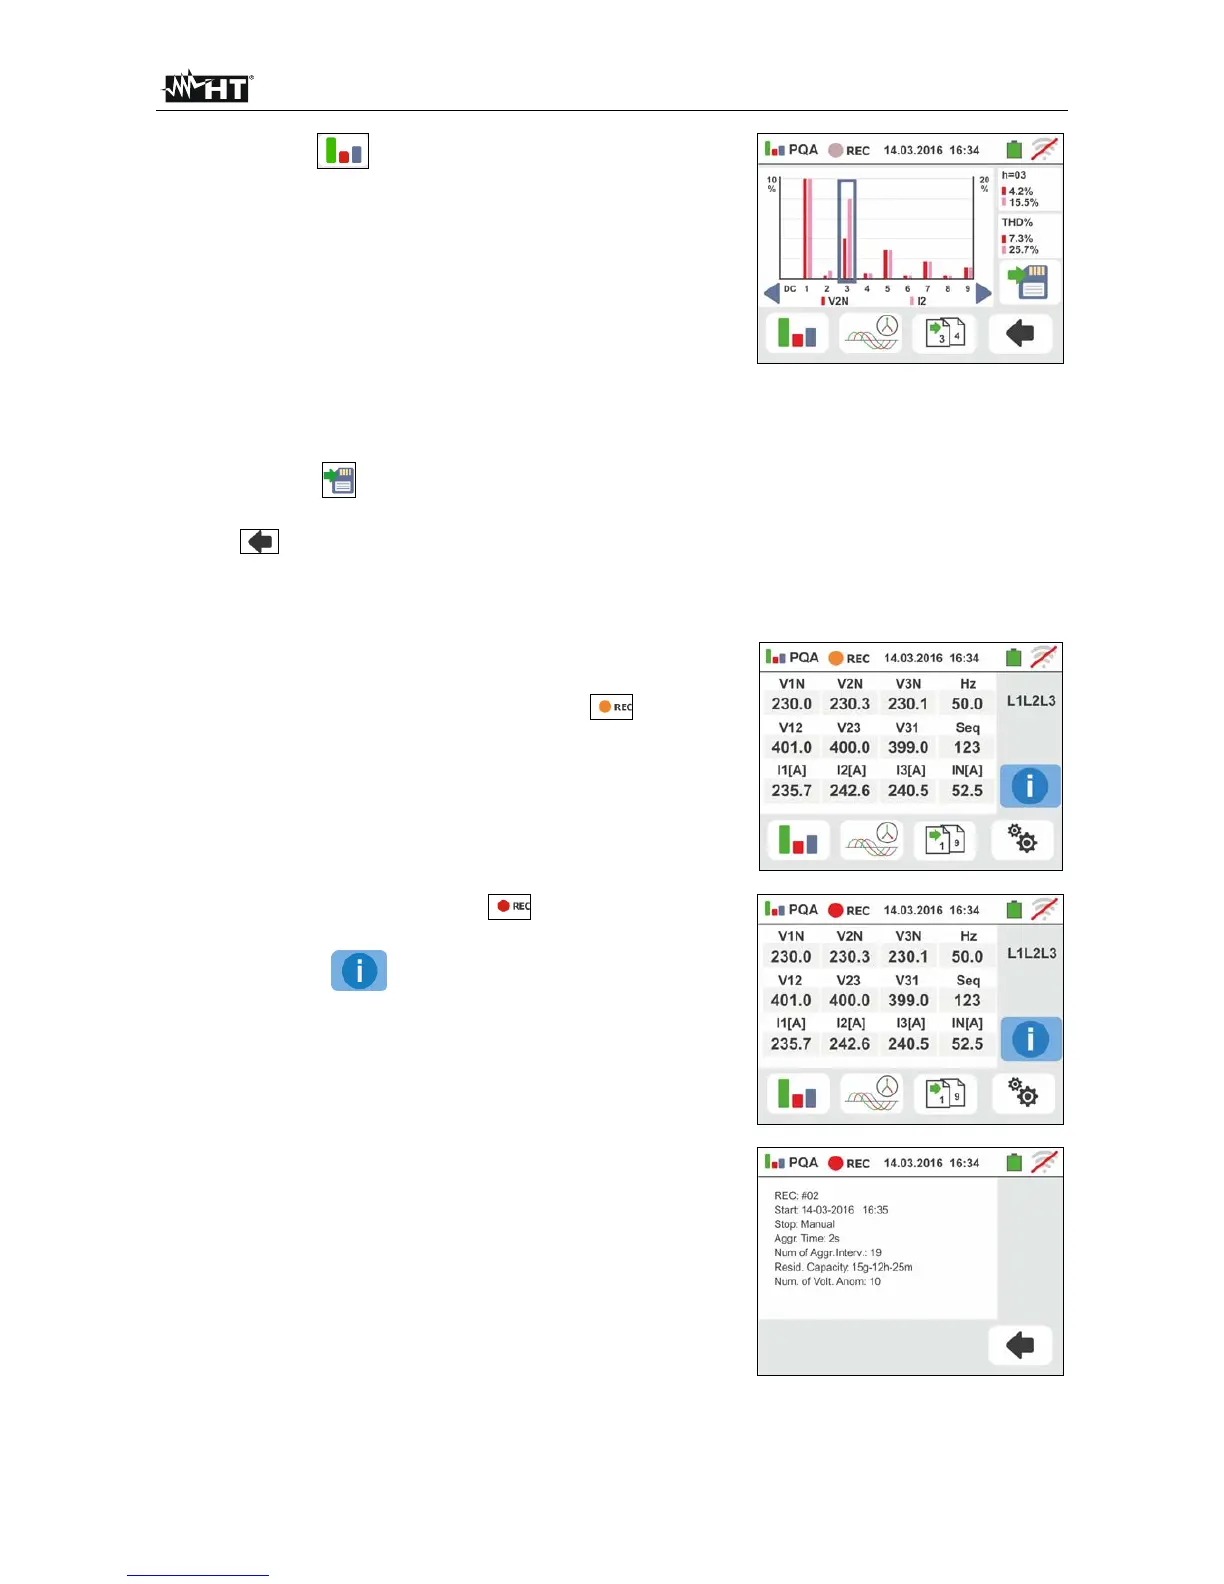
Touch the icon to show the parameters of
harmonic analysis. The screen like the one to the side
shows a three-phase situation. The histogram graph of
percentage amplitude relevant to fundamental and
voltage/current harmonics from DC, from the 1° up to
the 49° order, is shown on the display. A blue frame
automatically shows the harmonic with the highest
amplitude (except for the fundamental). The numeric
value of harmonic amplitude (identified by “hxx”) and
the THD% value (see §) are shown on the right side.
Touch the “” or “” arrow icons to increase or
decrease the harmonic order. Press the SAVE button
or touch the icon to save the measurement on the
display as instantaneous snapshot (see § 7.1). Touch
the icon to go back to the main screen of RMS
values
6.10.4. Start recording
13
Press the GO/STOP key to start recording. The
instrument enters stand-by mode (waiting for the next
minute or the set date/time) and the “ ” symbol is
displayed as shown in the screen to the side
14
With recording running, the “ ” symbol is displayed
as shown in the screen to the side.
Touch the “
” icon to read in real time the
information about the on-going recording. The following
screen appears on the display
15 The screen shows:
The number of the recording
The date/time of recording start (if automatic)
The date/time of recording stop (if automatic)
The aggregation time set
The number of aggregation intervals recorded
The residual memory capacity in DD-HH-MM
The number of detected voltage anomalies