130
AutoChart Live
ADJUST THE MAP DISPLAY SETTINGS
U
se the AutoChart Live Options menu to adjust the depth range, contour interval, and map position. You can also change the color
p
alette and shading.
Some of the menu options in this section may be displayed in other parts of the menu system so that you can access them quickly.
No matter where you make the change, the control head will update the setting across the system.
Open the AutoChart Live Options Menu
You will use the AutoChart Live Options menu for all display settings.
1. With a Chart View displayed on-screen, tap Chart in the status bar, or press the MENU key once.
2. Select AutoChart LIVE.
3. Select AC Live Options.
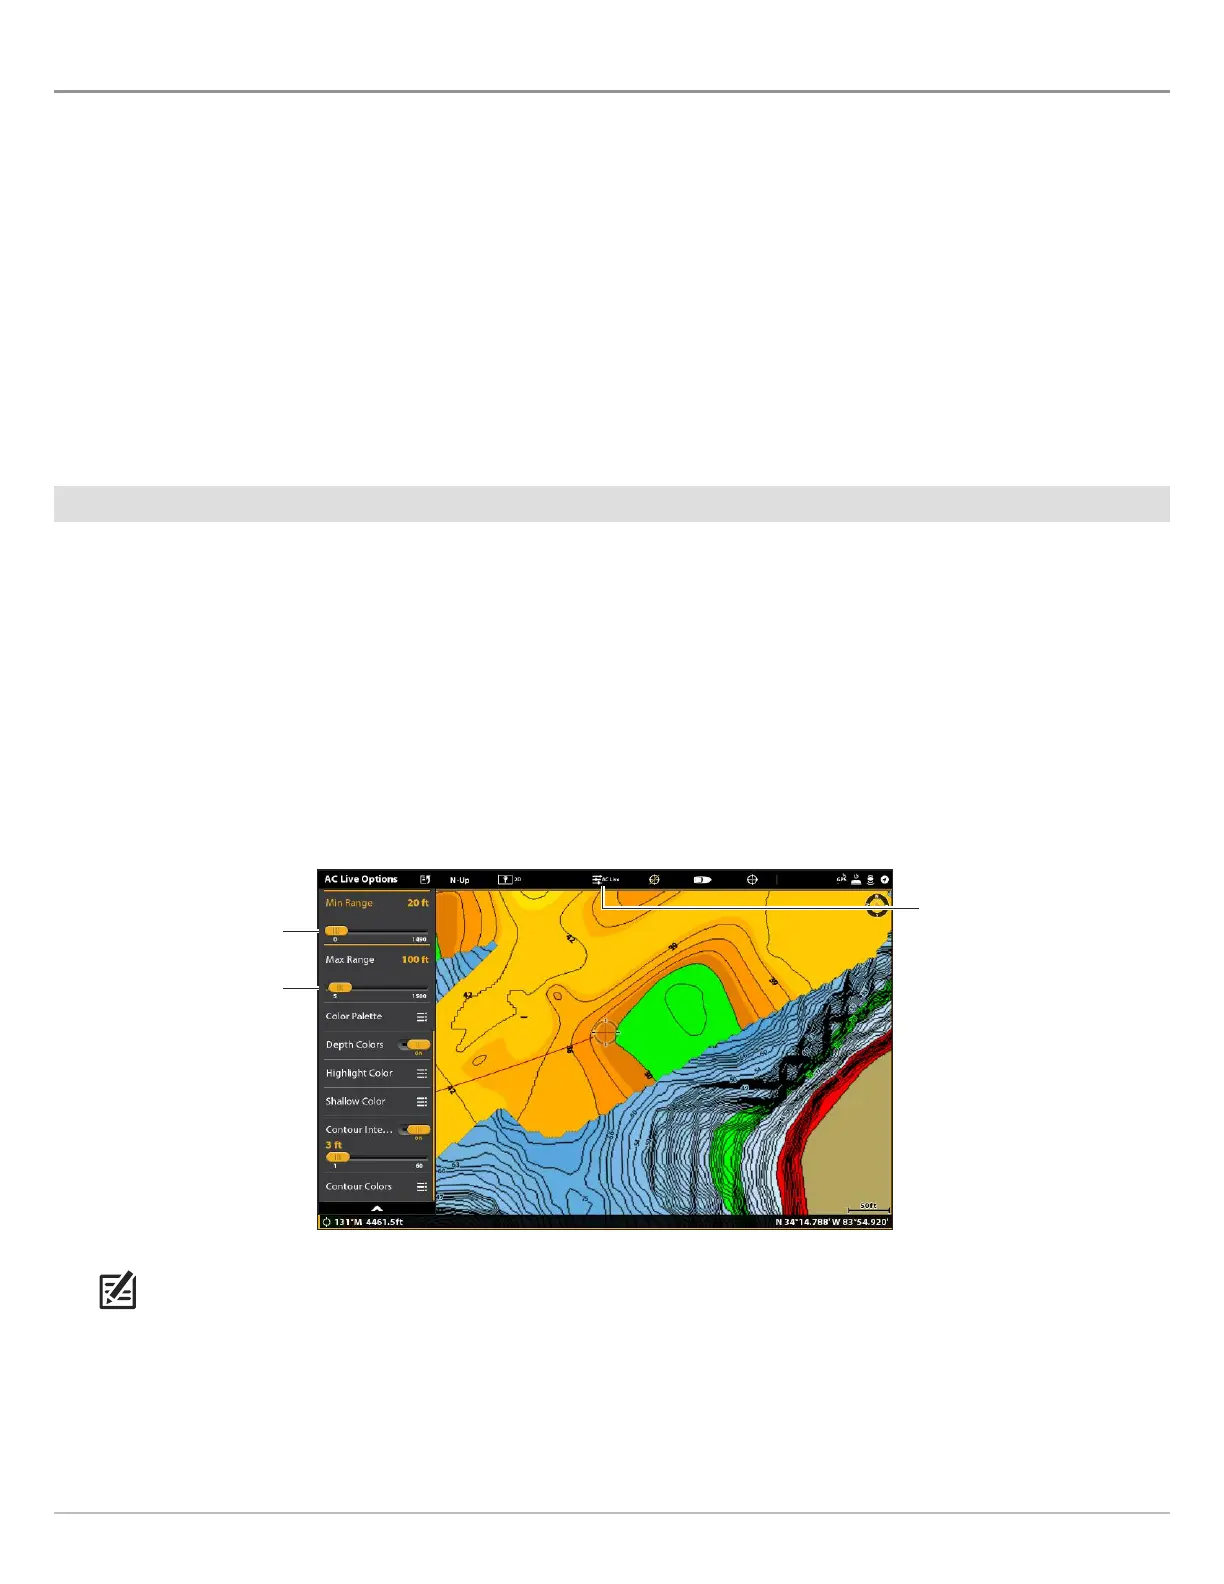
Adjust the Depth Range
You can adjust the range of data shown on the chart by changing the minimum range and maximum range on the display. The
range you select affects how the depth colors are displayed. For best results, set a narrow depth range threshold. For example, set
the Min Range to 10 and the Max Range to 30. For related color or shading options, see Add Settings with Chart Options.
1. From the AC Live Options menu, select Min Range.
2. Press and hold the slider, or press and hold the ENTER key, to adjust the setting.
3. Select Max Range.
4. Press and hold the slider, or press and hold the ENTER key, to adjust the setting.
QUICK TIP! You can also select this menu on the status bar. See the illustration above.
Adjusting the Display Depth Range
low range
high range
Tap to open the
same menu in
the status bar.
 Loading...