32
Data Logging
• Navigation keys scrolls the list page by page showing six items at the time. Press the function key
Options for alternatives on moving to the very end or beginning of the list and also to change units for
measured data.
• View logging graph – measured data displayed as a graph.
• Zoom in/out with the navigation keys
. Scroll right/left with the navigation keys . Press function key
Tracking to view logged data step by step. A vertical black line indicates the measuring point and data is
displayed below the graph. Move the tracking line with . Press function key No tracking to end.
• View logging statistics – overview of the maximum and minimum measuring points for each type of data
during the logged period.
5 Press function key Units to change any of the measuring units.
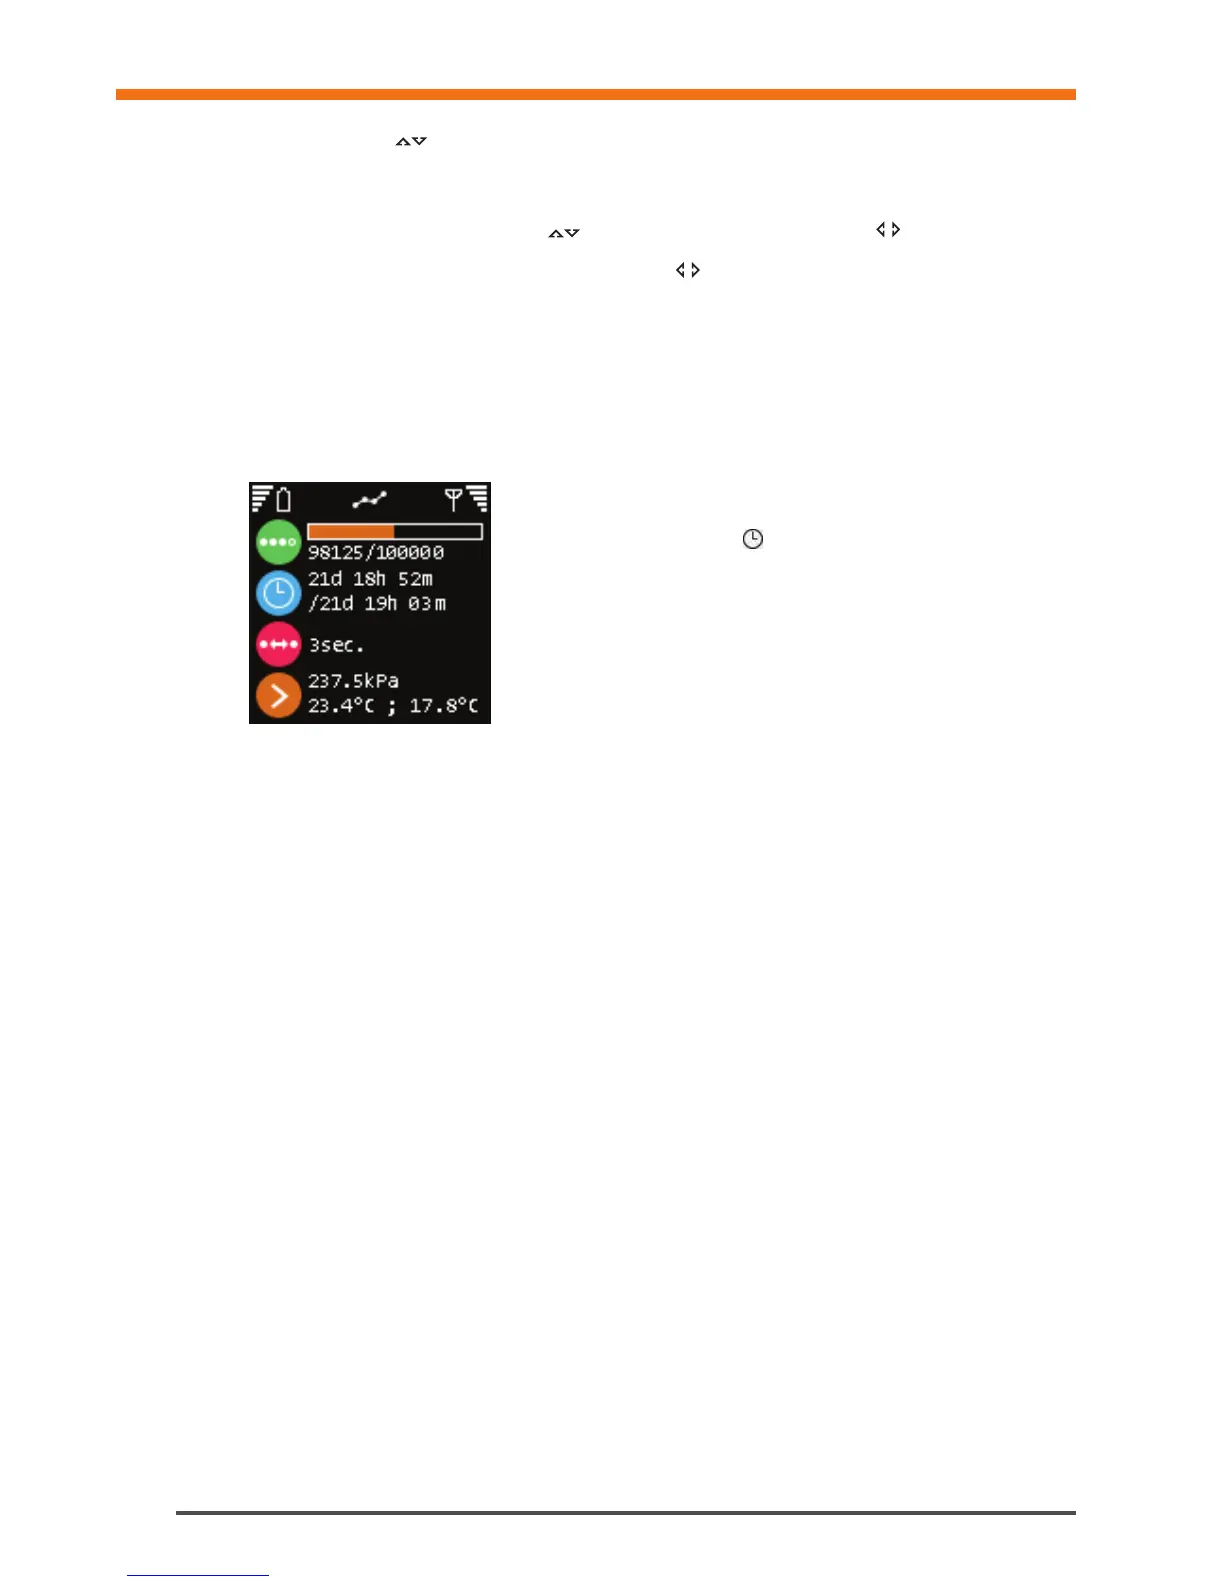
Logging – DpS-Visio
Logging progress (Replaced by
when a logging is waiting to start)
Progress in time / Total logging time
Time-step
Last logged values