Radar Target Generator - RTG1002 Edition Date: 19-Apr-18
In the example of the previous figure attenuator A consists of 3 separate components:2 attenuators of 30dB
and 1 attenuator of 20dB, the total amount would be 80dB.
The loss of a cable depends on the frequency and the cable length. If for example an attenuation coefficient
for the cable is 0.1dB/(m *GHz), you should multiply it by the cable length in meter and the frequency in
GigaHertz. If you have 10meter of cable the loss would be 1dB at 1GHz and 3dB at 3GHz.
You can enter a frequency table with multiple points, with a precision of 3.7MHz. The software will interpolate
the values in between data points, but it will not extrapolate.
In the example of the cable, if it is described with only two points at 1 and 3GHz, the values inside the
interval will be interpolated but the loss at 3.3GHz will be considered the same as at 3GHz. So it is
necessary to describe the losses up to the minimum and maximum frequency of operation.
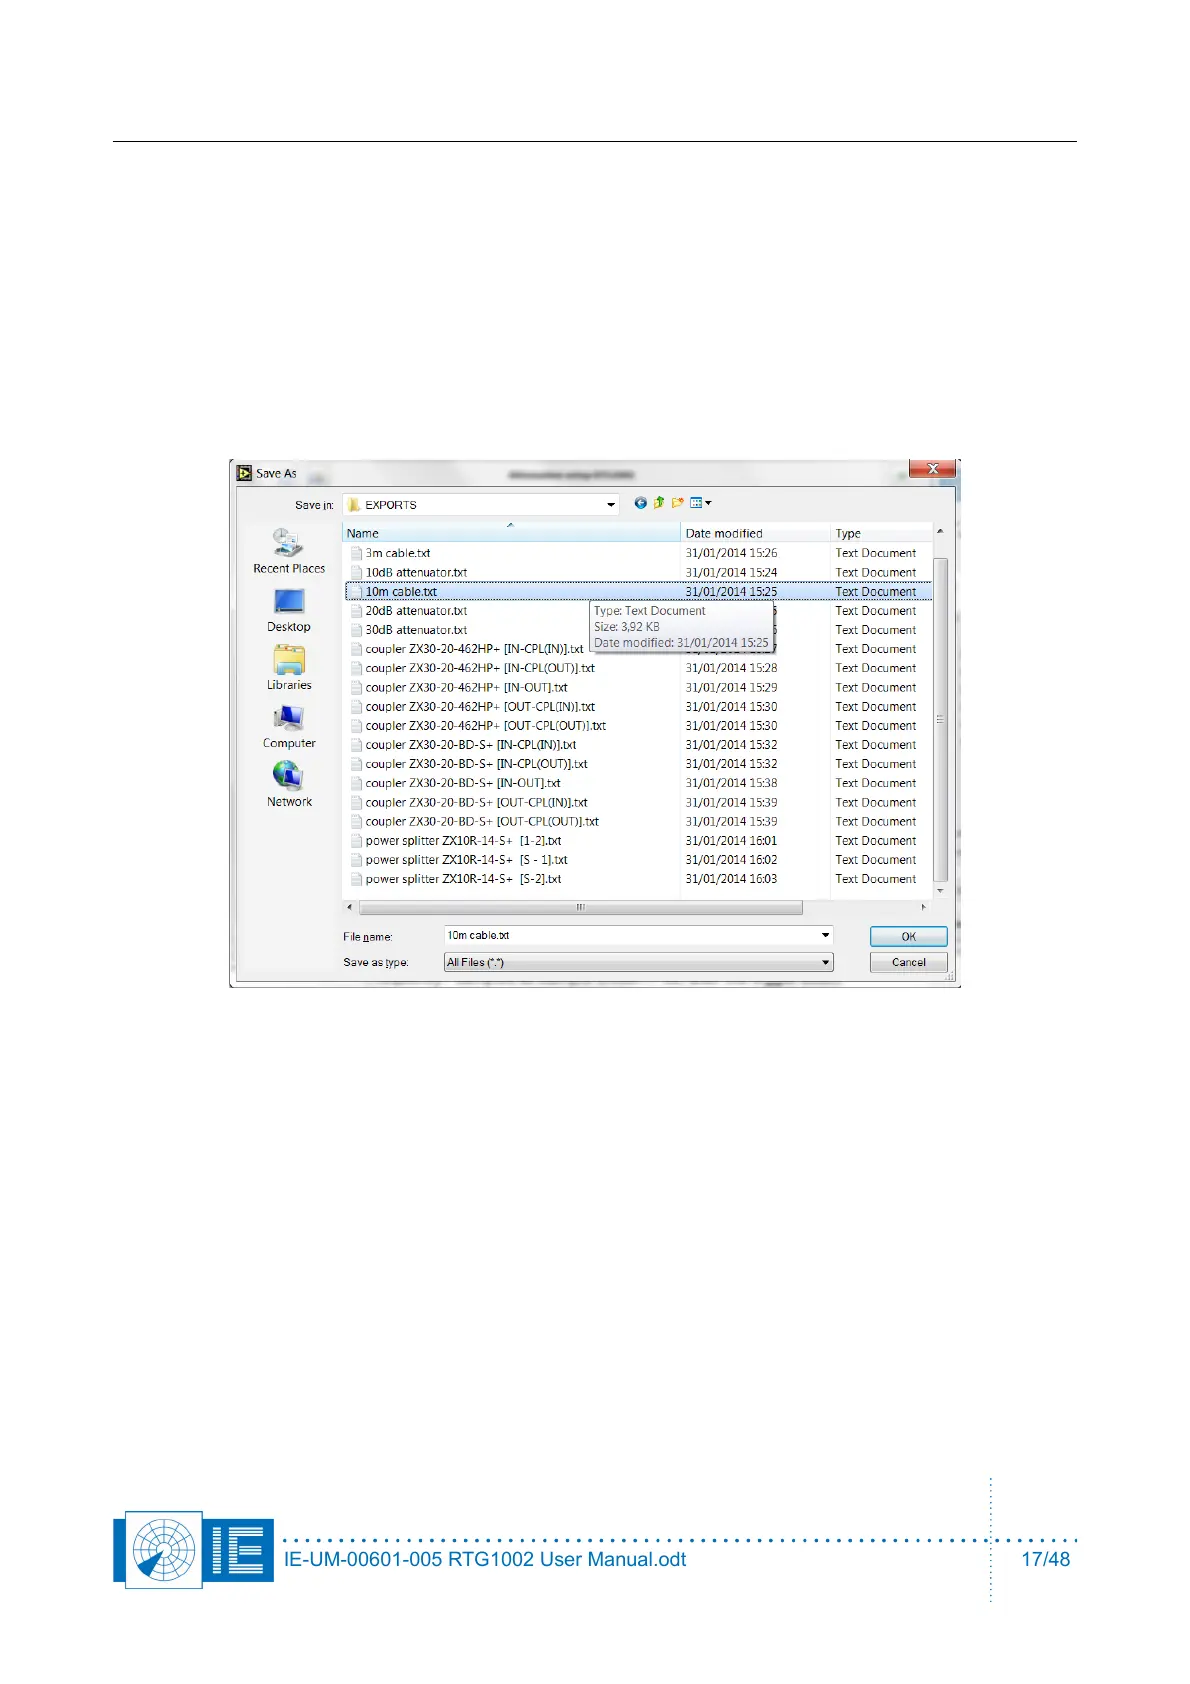
1. The loss of the cable set and all microwave components for L- and S-band applications, supplied
with RTG1002, have all been measured versus frequency. These files are available upon request or
they could be found in the general campaign in the folder exports.
2. Look in scope view at the received pulses, adjust the parameters for the frequency measurement. If
the radar uses different pulse lengths, the shortest pulse width will determine how to measure the
frequency. The power level indicated in the scope view is only calibrated for the frequency entered
as a parameter (the frequency is not yet measured in this view) and for the trigger level also.
3. Make sure the received peak power is the same as the predicted peak power. Especially when the
adaptive beam modulation is used. Every dB of Rx power received less then the predicted peak
power will be reduced from the calculated Tx power. If the powers do not match check the setup.
Maybe there is a ground reflection that increases or decreases the power. If you can change the
height of the antenna (possible on a tripod) a variation of 1 meter may already indicate this effect for
S-band radar at a distance of a few hundreds of meter (depending on the radar height).
4. View the input data in Pulse View mode. The following views are available:
RX power RTG input : sampled at Sample Offset … us, after the trigger event.
IE-UM-00601-005 RTG1002 User Manual.odt 17/48