Page 4444 Operating Instructions Powador-proLOG_EN
Se ction 9 · Configuration Exam ple
9.1.2 Current input
Calculation rule for the relationship between the measured
value and the physical value:
9.2 Digital inputs
The following equation applies for the conversion:
Example:
A meter supplies 6,000 pulses / kWh and is to be connected to
a digital input. This meter constant is entered in the “Pulse
constant” box in the browser. The desired time interval is
entered in the “Interval for current power” box. The pulses are
added up during the time interval and converted to the mean
power for this time interval.
9.3 Alarm criterion
An example is given here to explain how the WEB’log can be
used to implement simple and effective system monitoring.
Example:
A photovoltaic system is equipped with an irradiance sensor
for measuring the irradiance at the module level, and a power
generation meter with a pulse output.
The system is to report a defect via an alarm call.
9.3.1 Monitoring principle
The relationship between irradiance and generated power is
calculated:
[generated power] = [irradiance * area of module * eta
module * eta inverter]
For PV modules with an efficiency of 12%, an inverter effi-
ciency of 91% and a module area of 10 m2, the idealized rela-
tionship can be represented graphically as follows:
Relationship between irradiance and generated power
P
ac
Power in kW
G
mod
Irradiance in W/m
2
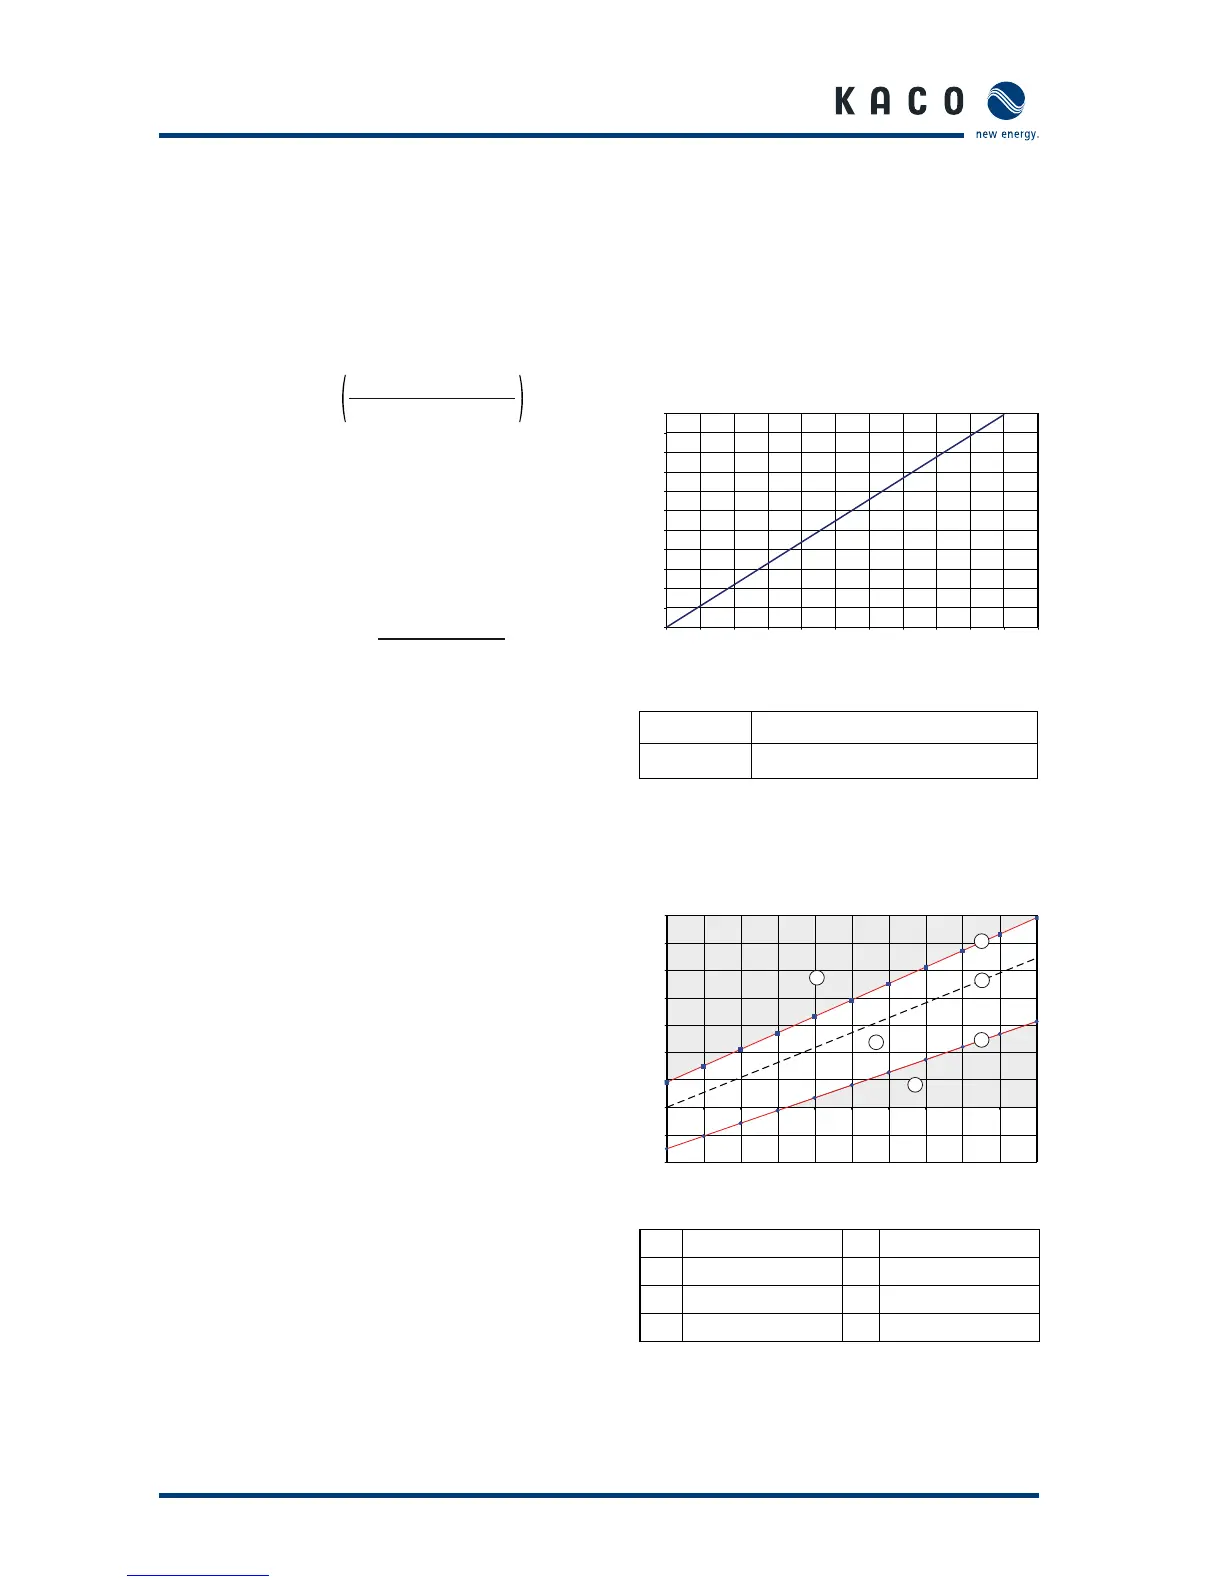
In practice, the relationship between irradiance and generated
power is not exactly linear (lower irradiance > low efficiency).
For this reason, a range is defined within which the measured
values may vary.
Valid range for measured values
P
ac
Power in kW (3) Lower limit exceeded
G
mod
Irradiance in W/m2 (4) Upper limit
(1) Upper limit exceeded (5) Ideal relationship
(2) Upper limit exceeded (6) Lower limit
To allow maximum flexibility in defining the range, the straight
lines of the lower and upper limits can have different gradi-
ents.
The offset of the straight lines by tupper and tlower is defined
as an absolute quantity.
Physical measured value
=
 Loading...