53210A Math, Graphing, and Data Logging 6
Keysight 53210A User’s Guide 165
Histograms
The distribution for a given set of counter measurements (except continuous
totalize and time stamp measurements) can be represented graphically using
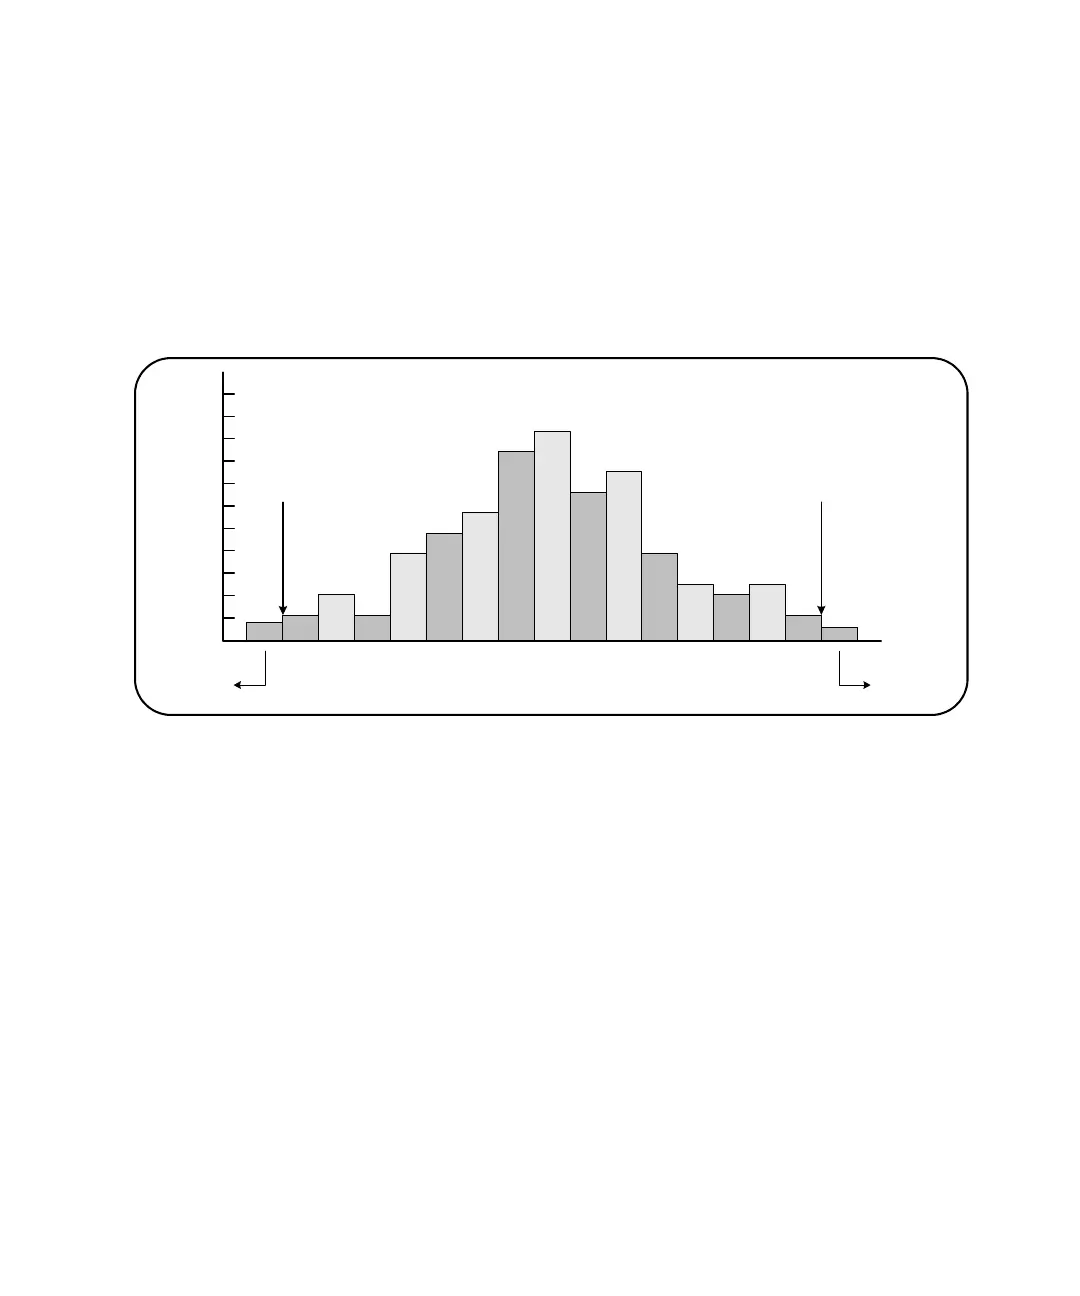
the 53210A histogram feature. The following example (Figure 6-5) represents the
basic format of a counter histogram.
Figure 6-5 53210A Histogram Structure.
Note that histograms and math functions (e.g. statistics, scaling, limits, etc.) can
be used simultaneously with the same measurement data.
1432
5
67
8
9
10
11
12
13
14
15
count UR
LR
Bins
Rdgs < LR Rdgs > UR
Bins = classes = points
LR = Histogram lower range boundary
UR = Histogram upper range boundary
 Loading...