98 User’s Manual TOS93 Series
Earth Continuity Test | Starting a Test
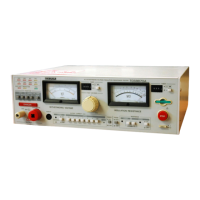
Measurement display
During a test, measurements are shown on the display.
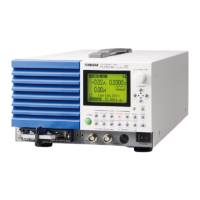
Test condition display
Icons indicating the test conditions appearing during testing.
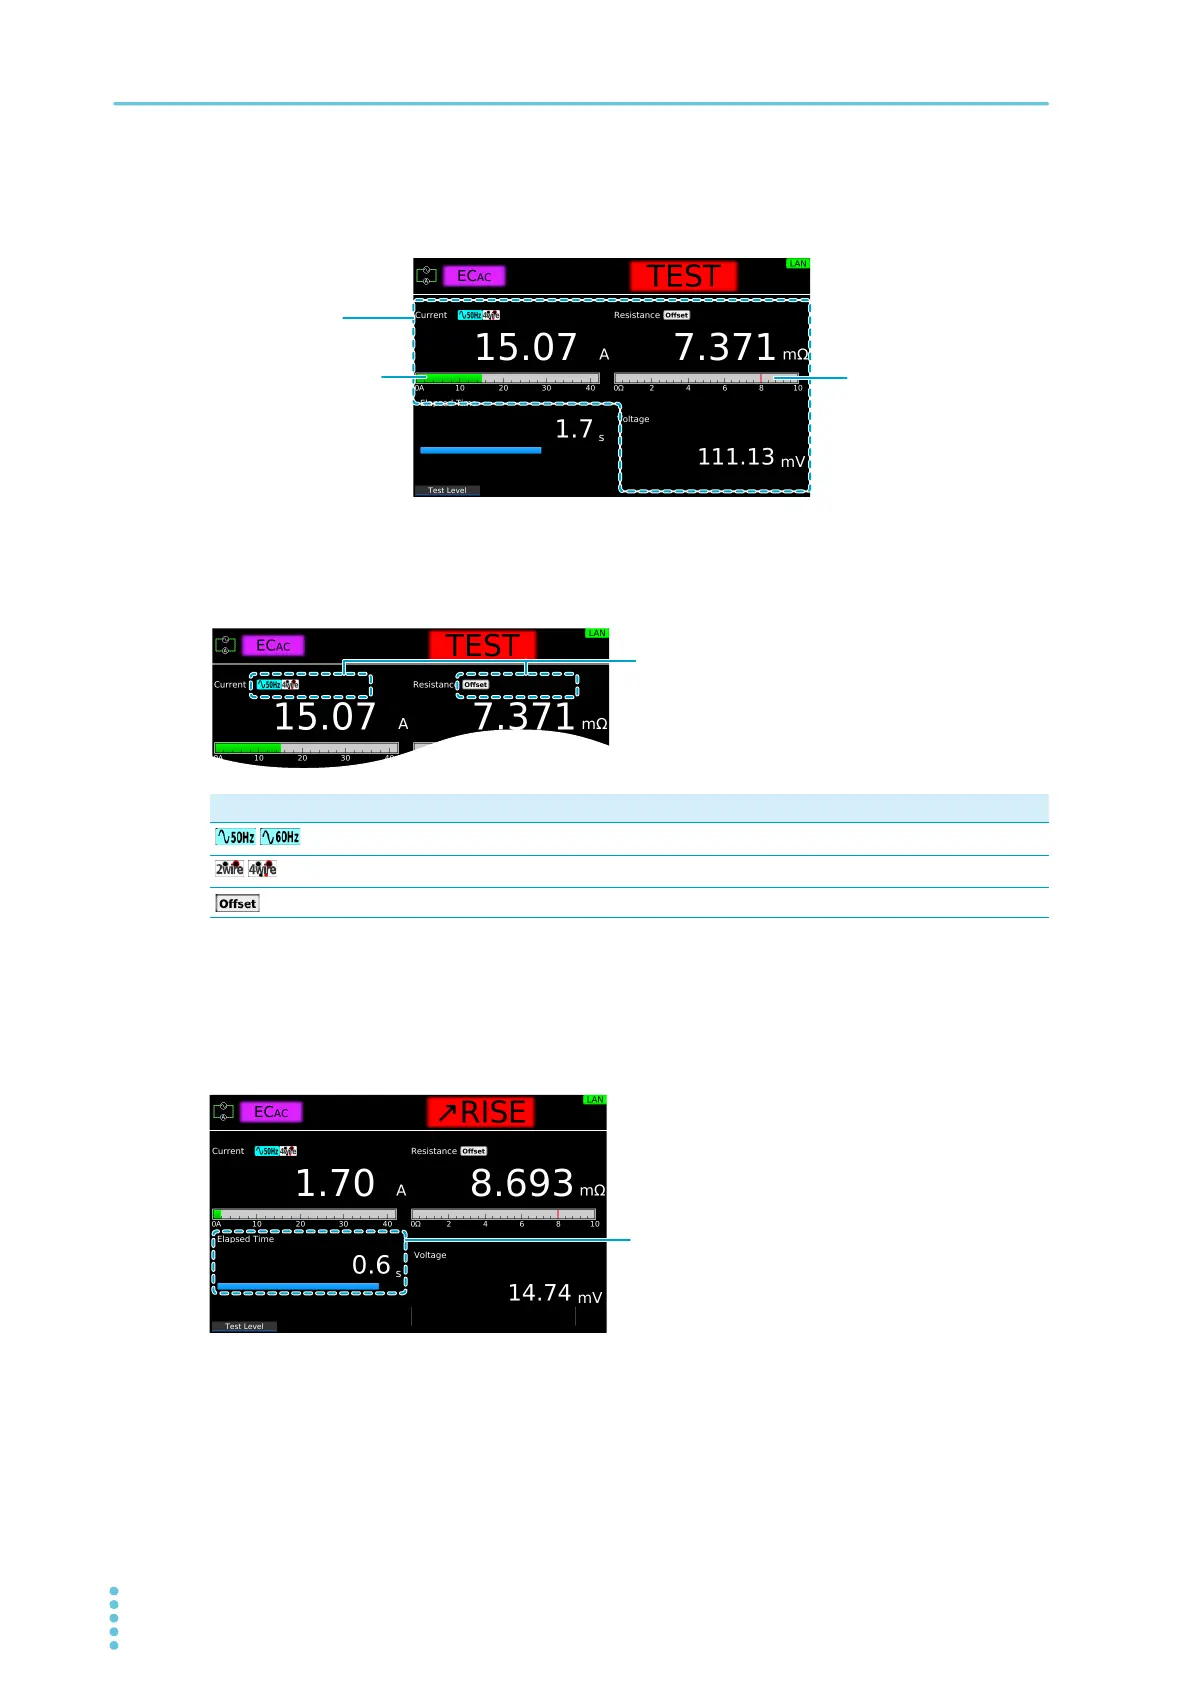
Current rise time display
While the current is rising, “RISE” is displayed along with the elapsed time. The remaining rise time is dis-
played with a bar graph. When the time specified by Rise Time elapses, “TEST” is shown, and the test
starts.
Icon Description
/
Frequency setting (50 Hz/60 Hz).
/
Terminal Wire setting (2Wire/4Wire)
Offsetting.
Measurement and
bar graph
Displays the ratio of the
output current relative
to the Test Current
setting using a bar
graph
Displays the ratio of the
measurement relative to
the Upper value using a
bar graph
Elapsed time. The remaining rise time is
displayed with a bar graph.
 Loading...