Product Service 1-800-522-7658
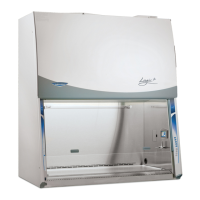
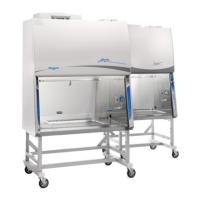
QuickChart – Cell Logic+ Type A2 BSCs Metric
Units
Nominal Avg. Downflow (m/s)
grid # of points (rows x columns)
Grid distance from back & sides (mm)
Distance between rows (mm)
Distance between columns (mm)
Nominal Average Inflow (m/s)
Nominal Avg. Exhaust Vol. (m3/s)
Avg. Exhaust Vol. Range
(m3/s)
Sensor distance (inches)
2
Nominal Avg. Inflow Vel. (m/s)
Avg. Inflow Vel. Range (m/s)
Average Inflow Volume Range
(AIV) (Avg. velocity x CF)
Inflow Velocity Range
(AIV / Sash open area)
HEPA Filter Leak Test Data
Theoretical aerosol conc. (ug/l)
3
Actual aerosol conc. (ug/l)
4
Width x Depth x Height (in.)
5
Performance (Pressure in. H
2
O)
Width x Depth x Height (in.)
5
Performance (Pressure in. H
2
O)
Fluorescent Lamps (2 each)
Fluor. Lamp Labconco Part #
Fluor. Ballast Labconco Part #
Canopy Inflow Range (m/s)
Nominal Canopy Slot Velocity (m/s)
Nominal Canopy Slot Volume
(m3/s)