HVM200 Reference Manual Making the Measurement 3-10
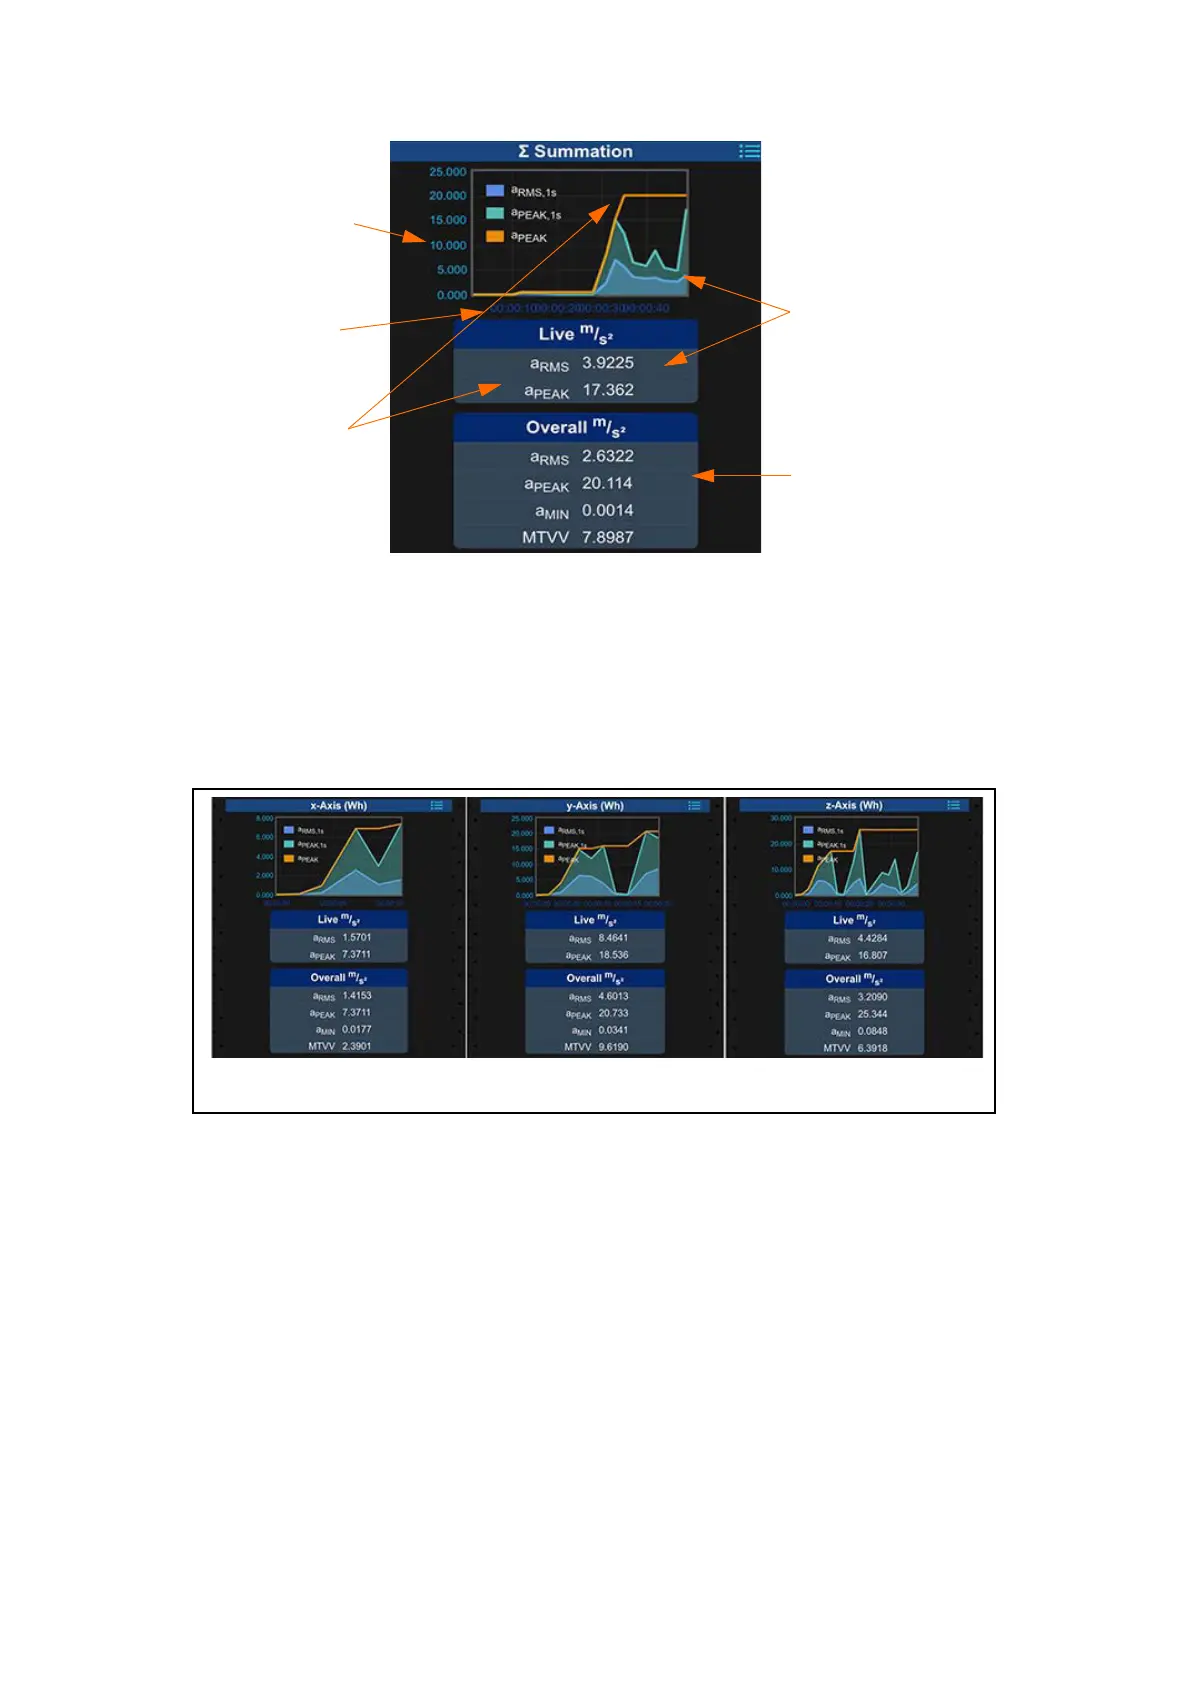
FIGURE 3-14 Summation Data Display
For more information on summation values, including Vibration Dose
Value (VDV) and the daily vibration exposure value over eight hours
A(8), see the "Glossary" on page C-1.
The Axes displays provide real-time graphical and tabular representations
of current and overall values for each axis, similar to Figure 3-14.
FIGURE 3-15 X, Y, and Z Axes Data Displays
Overload and Under-range Indicators
Overload
LEARN MORE For information on
overload indications on the Status
LED, see “Operational Characteris-
tics” on page A-4.
An overload occurs when the signal from the accelerometer exceeds the
input range of the meter.
Vibration values accord-
ing to specified units
Measurement Time
Current a
RMS
value
Current a
PEAK
value
Overall measurement data