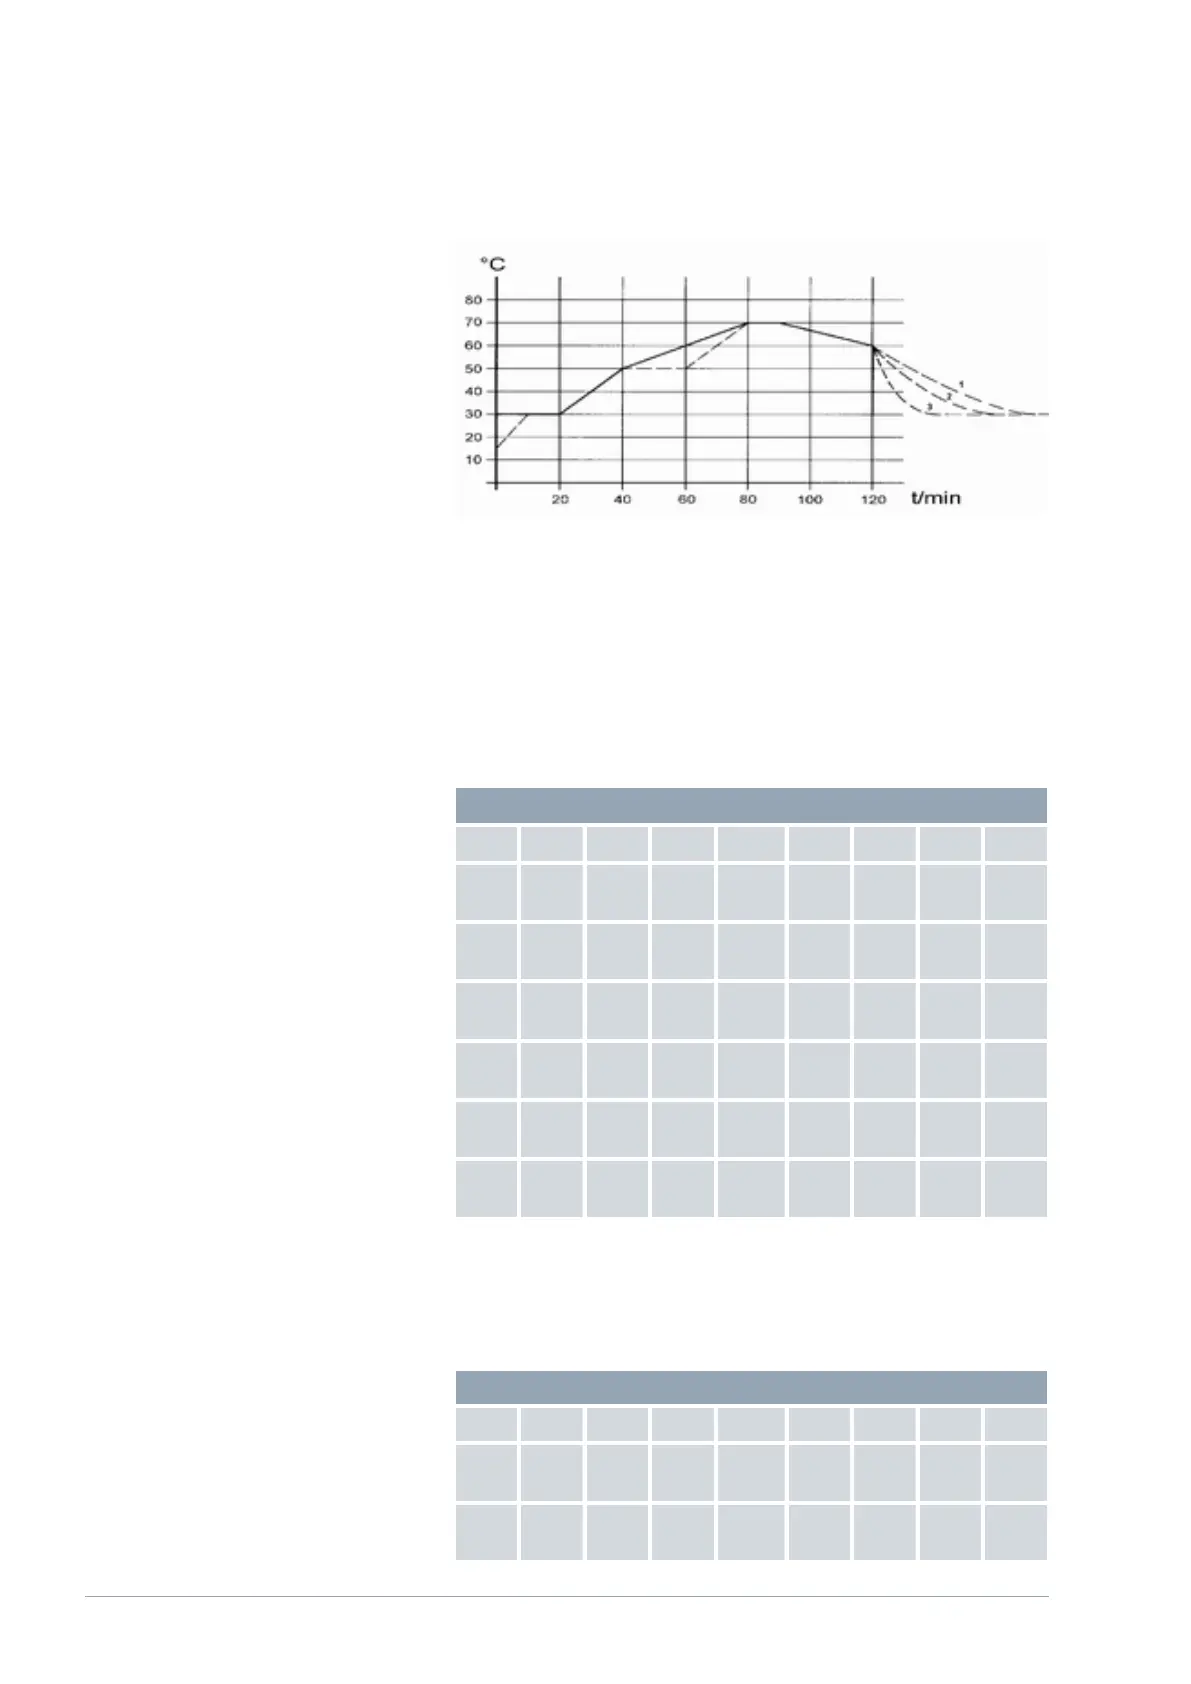
Fig. 56: Program example
The cool-down time in the graph varies depending on the device type,
consumer and so on. In example segment No. 2, 50 °C should be reached
within 20 minutes.
The original values in the "Before" table provided below are represented by a
solid line, while the edited profile of the "After" table is shown by a dashed
line.
Table 10: "Before" table
(
____
)
No. Tend hh mm Tol Pump S1 S2 S3
Start 30.0
0
-- -- 0.1 --- o o o
2 50.0
0
0 20 0.0 --- o o o
3 70.0
0
0 40 0.0 --- o o o
4 70.0
0
0 10 0.1 --- o o o
5 60.0
0
0 30 0.0 --- o o o
6 30.0
0
0 0 0.0 --- o o o
A new segment with the number 3 was entered in the edited table. The time
for the segment with number 4 was also changed. The tolerance for the
segment with number 5 was adjusted.
Table 11: "After" table
(- - - -, editet)
No. Tend hh mm Tol Pump S1 S2 S3
Start 30.0
0
-- -- 0.1 --- o o o
2 50.0
0
0 20 0.0 --- o o o
V08Variocool62 / 97