13
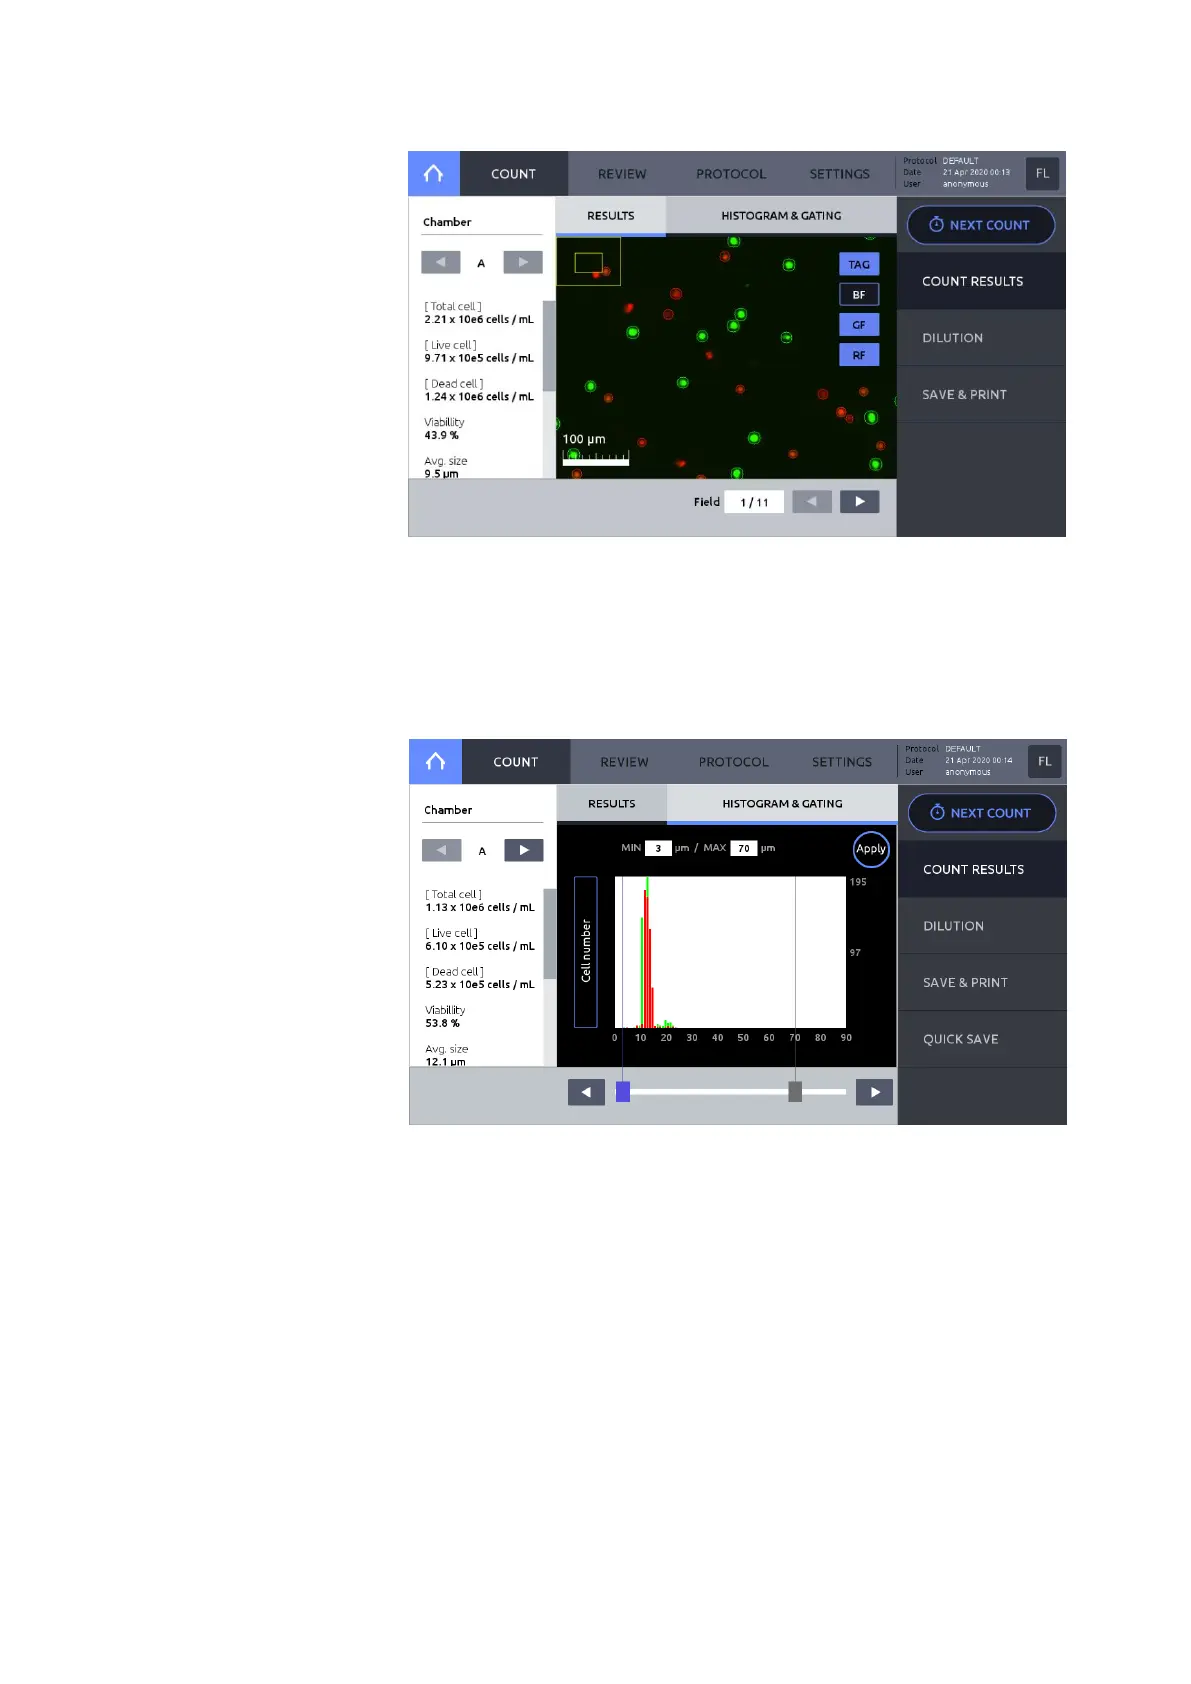
Press TAG to identify live (green circles) or dead (red circles) cells.
After fluorescence cell counting, BF, GF, and RF images can be viewed separately
or in overlay.
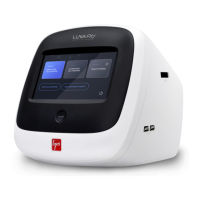
Press HISTOGRAM & GATING to open the histogram window.
Cell concentration or number can be graphed according to cell size. Cell size gating
parameters may be changed by pressing the slider rectangles. An active slider will
be highlighted in blue. Move the sliders by dragging or pressing the arrows.
Press Apply to set cell size gating parameters. Counting results will adjust
accordingly.
To toggle between cell concentration, cell cluster, and cell number press the Y-Axis
title (e.g. Cell Number).