6.2 Levey-Jennings Plots (continued)
Displaying and
printing L-J Plots
To display and print the L-J plots, follow the instructions below:
Enter the QC menu and press [VIEW CON/CAL].
Scan the barcode label on the blood control tube, with the barcode reader,
select control from Select Con/Cal Sample Menu, or manually enter in
value.
Press [L-J VIEW] to display the Levey - Jennings plots.
Scroll through parameters by choosing [MORE].
Print diagrams by choosing [PRINT].
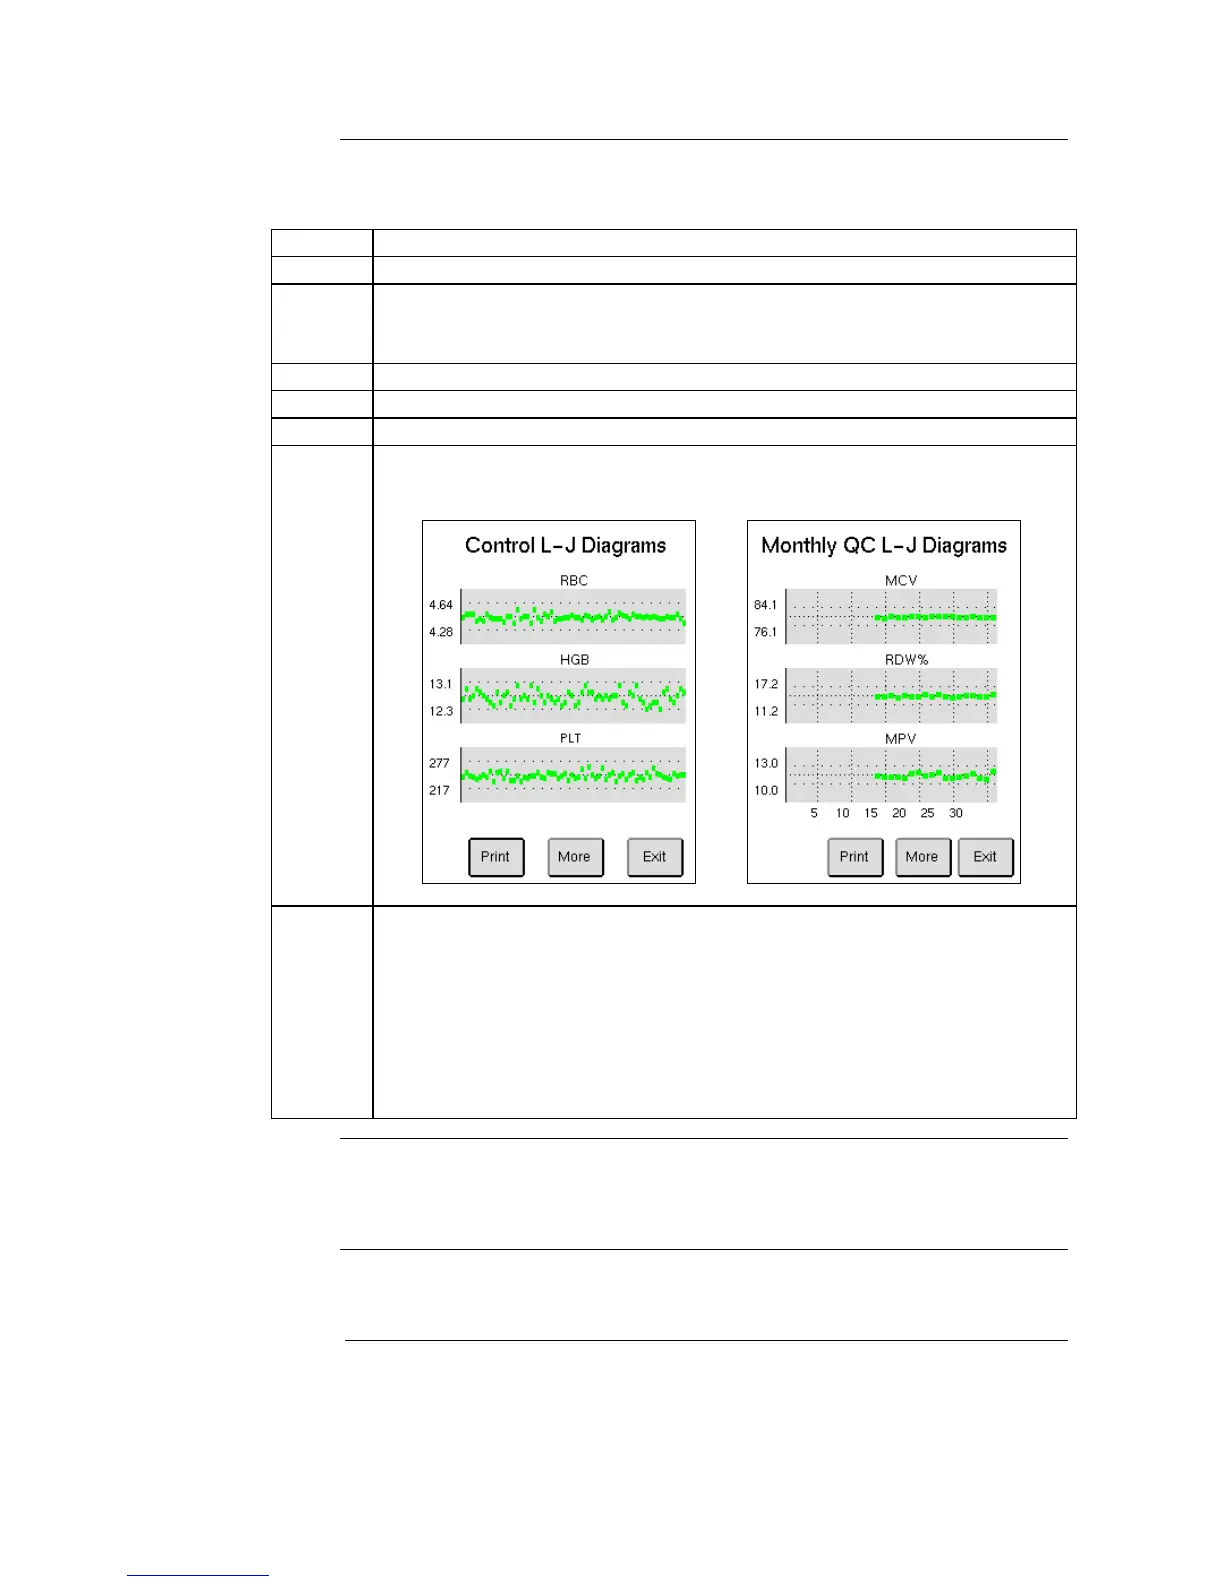
Image 6.7 below is constructed from several samples and will not be shown
as below until a sufficient amount of samples have been analyzed.
A Monthly QC L-J Diagram report can also be viewed and printed:
Follow Steps 5 -6 in Section 6.1 to select control lot and month.
Press [L-J VIEW] to view the monthly diagrams. The Monthly L-J
diagrams will differ from the normal L-J plots as the x-axis uses the
expected range for its out-of-bounds criteria and on the y-axis the points
can be visibly traced to which day of the month it was analyzed on.
To print the diagrams on the displayed page, press [PRINT] or to print all
diagrams, scroll to the last display page without plots and press [PRINT].
The L-J plots are displayed for all parameters defined in the Assay Sheet
except the WBC differential parameter “MID”.
If a control shows a system information indicator, the parameter values of such
a control will not be included in the L-J plots.