6.3 Initialization and Use of Xb Function
The Xb function in the Medonic M-Series follows strictly the Bull algorithm
for the parameters MCV, MCH and MCHC. These parameters should not drift
as a function of time within a large patient population. The recommended range
setting is ± 3% from the expected mean value of these parameters.
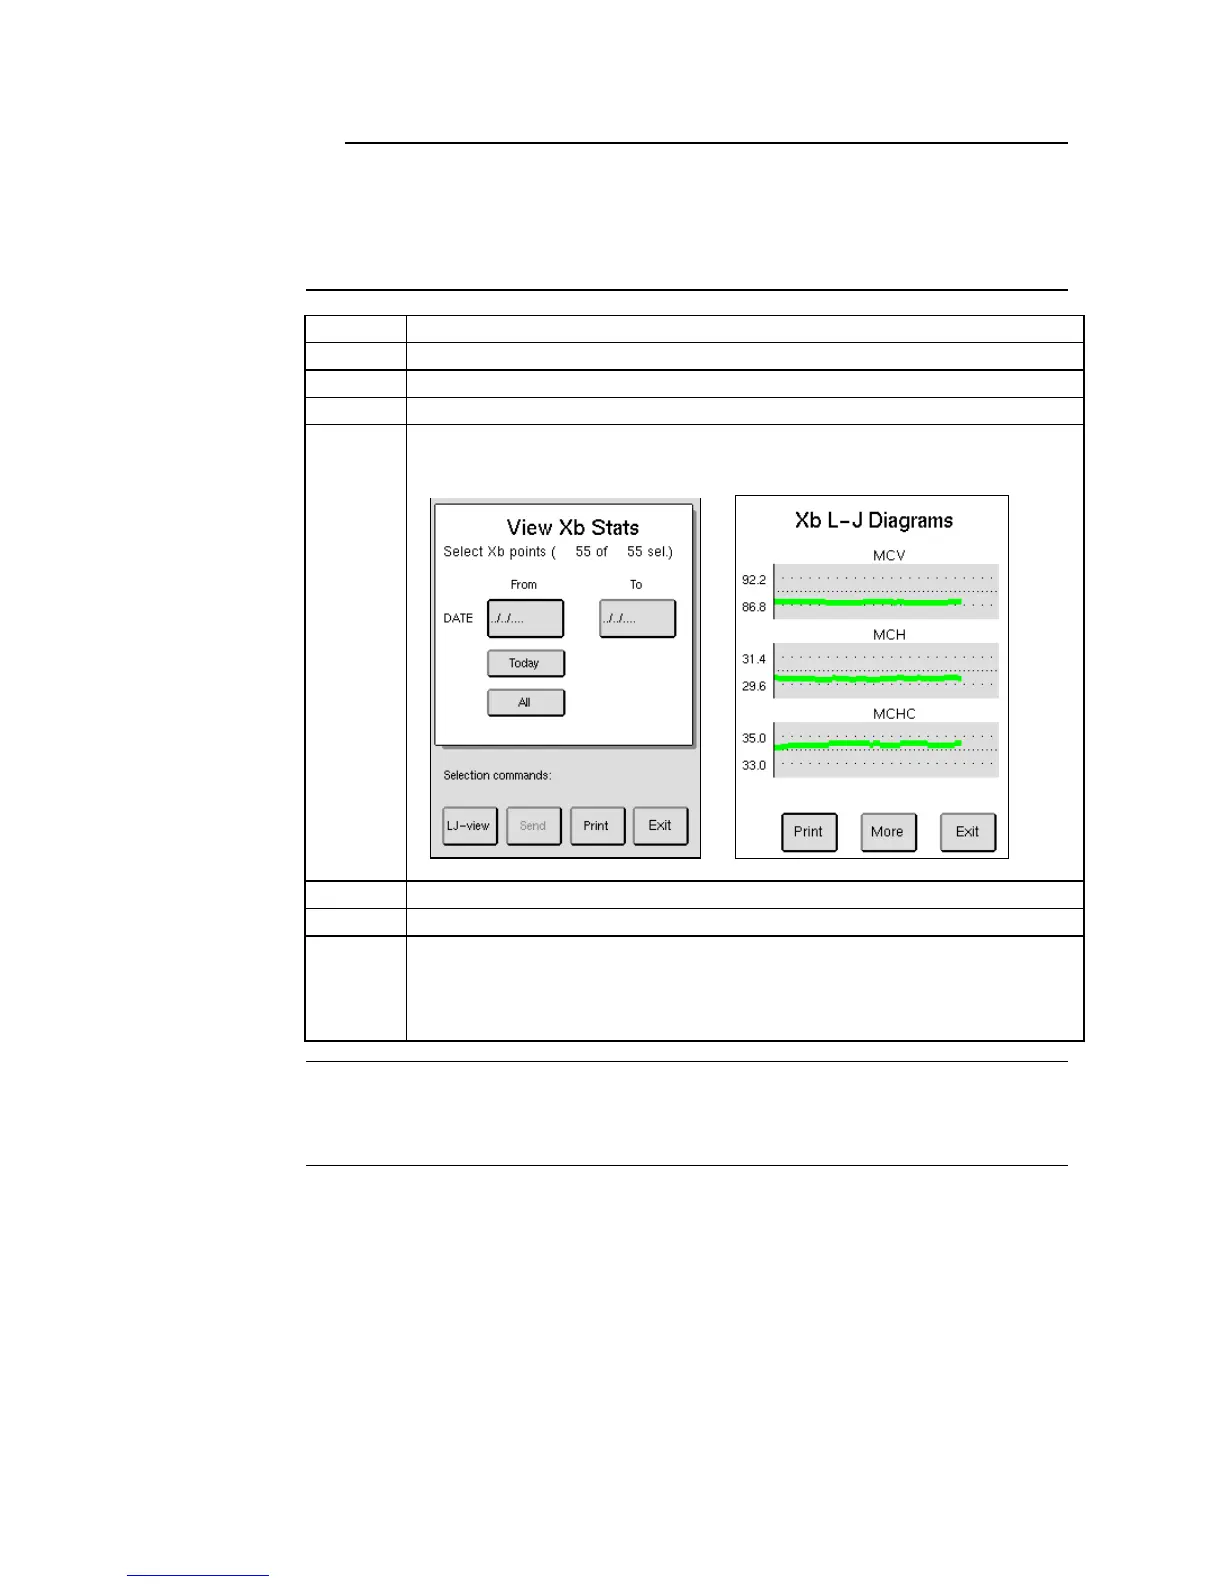
Enter the QC menu and press [VIEW Xb STATS].
Select Xb points by Date or by default all sample data is selected.
Press [LJ VIEW] to display Xb L – J diagrams.
The image below is constructed from several samples and will not be
shown as below until a sufficient amount of samples have been analyzed.
Select [MORE] to view selected conditions and matched ranges.
Print diagrams by choosing [PRINT].
To change ranges on Xb Diagrams go to Setup Menu 3 and press [XB
RANGE SETUP]. Here operator can change low and high ranges on the
three parameters. To update or change Xb range setup input the
Authorization Code [2576].
Bull BS, Hay KL. The blood count, its quality control and related methods: X-bar calibration and
control of the multichannel hematology analysers. In: Clangoring I. editor. Laboratory
Hematology: An account of Laboratory Techniques. Edinburgh.