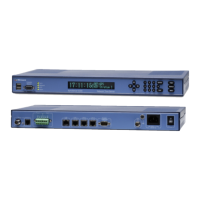
Web Interface
Charting PTPPerformance
The PTP Performance chart is handy to show how your network traffic is occurring dynam-
ically. For example, the cause of a spike at traffic occurring at a certain time each day could
be investigated, improving the network performance.
To Create a Chart
Click the CHART button to view a chart of the PTPpacket performance. After several
seconds, a chart will appear. The chart will show the selected data set. Delay data sets have
a red chart line, and sync data sets have a black or blue chart line. Both data sets are drawn
against a timeline of the 15 minute intervals.
To view different data sets, click the Data Set button. Available selections are:
l E2E Packets
l P2P Packets
l E2E Packet Errors
l P2P Packet Errors
l E2E Queues
l P2P Queues
l Daemon Resets
PTP - Save-Restore
Use this page to Save or Restore PTP Grandmaster Configuration settings.
The current PTP Configuration is displayed, reflecting values set up on the PTPMaster web
page. An example of settings is:
Transport Protocol UDP Priority 1 128
Sync Interval 1 pkt/1 sec Priority 2 128
Delay Mechanism E2E Domain Number 0
Packet TTL 1 Mean Announce Message Transmit Interval 2 sec
E2E Delay Interval 1 pkt/1 sec Announce Receipt Timeout Multiplier 3
P2P Delay Interval 1 pkt/1 sec
To Save Configuration Settings to a File
Click the Save As... button.
Page 60..........................................................................997-01520-02 Rev. F1