4.16.3 Bar Graph Display
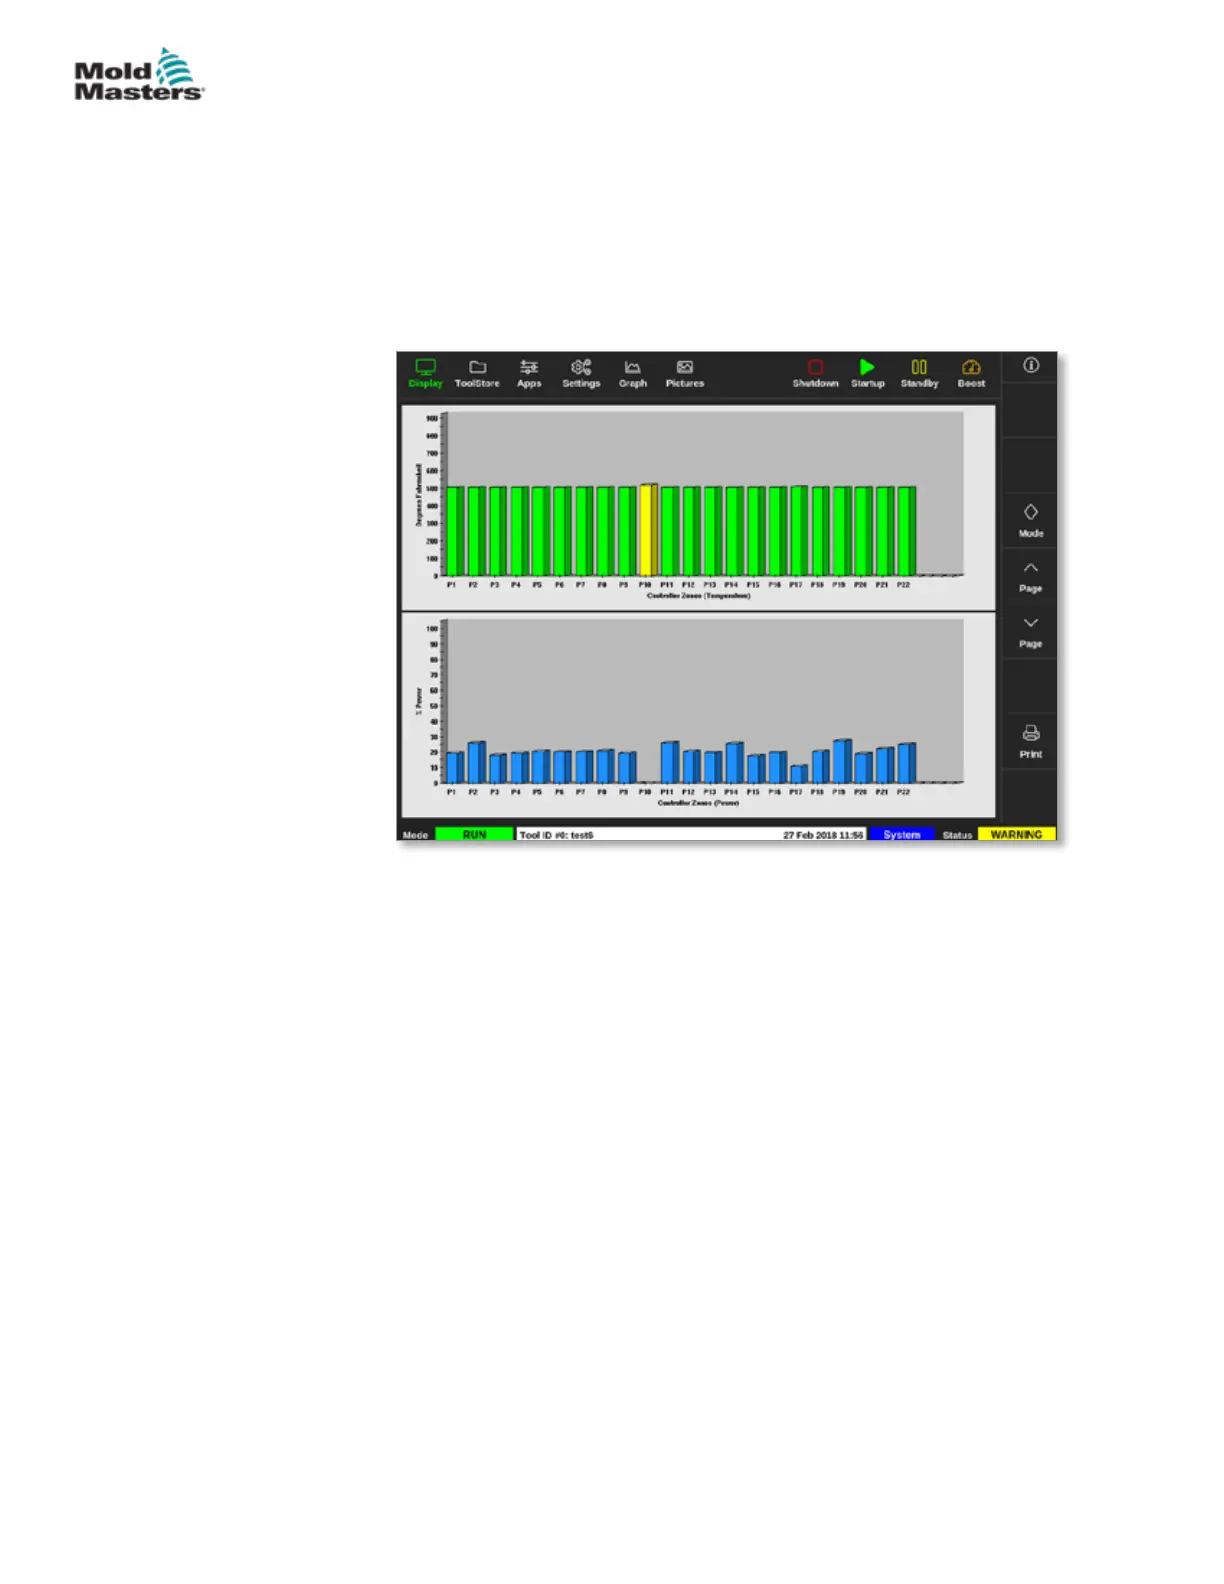
The bar graph display shows the zones in graph format against the variables
of temperature, power and ow, depending on their conguration. The status
of the zones is indicated by the color of the columns. Figure 4-19 shows zone
10 in yellow, which indicates a warning status.
The [Mode] button and the [Print] buttons are available in the right hand
menu.
Use [Page p] or [Page q] to see the zone types in sequence.
Figure 4-19 Display screen - bar graph view
4-24
© 2021 Mold-Masters (2007) Limited. All Rights Reserved.
OVERVIEW
M2+ Controller User Manual


 To Next Page