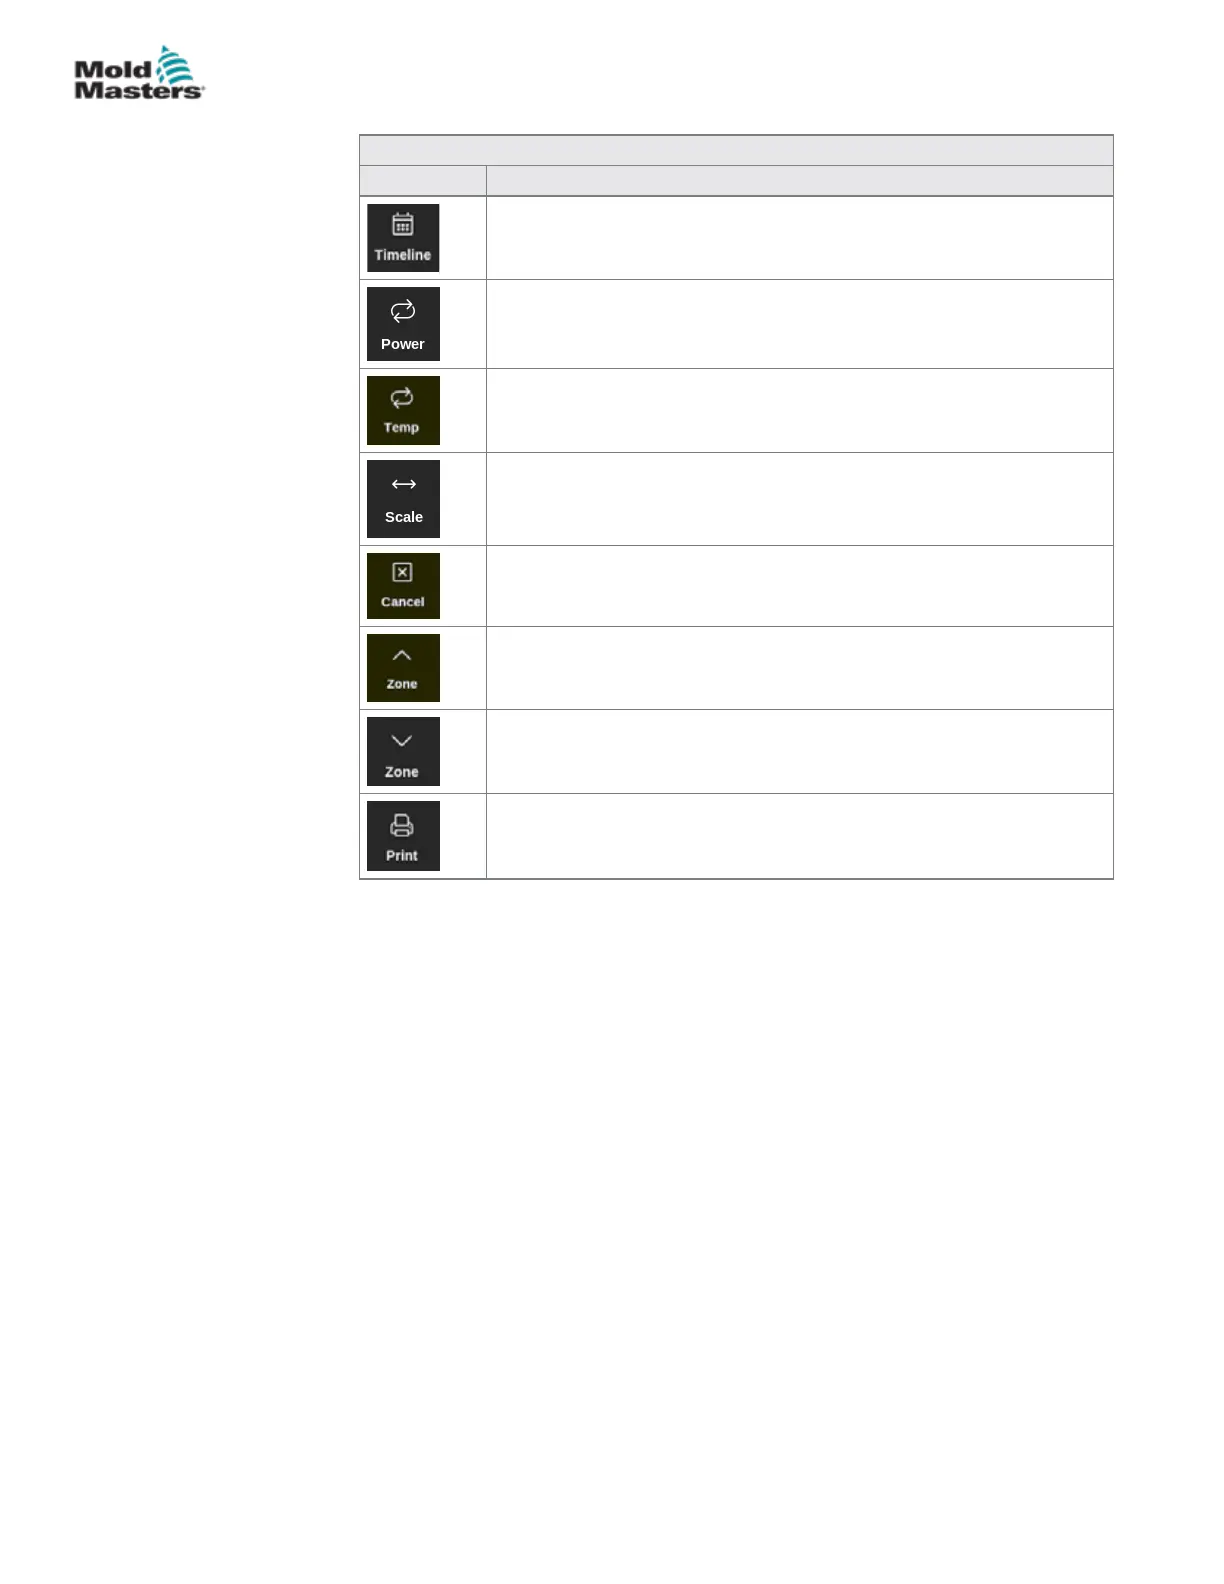
4.21.1 Graph Screen Side Menu Buttons
Table 4-13 Graph Screen Side Menu Buttons
Button Functions
To show history of operation for selected tool. Timeline is shown in
bottom information bar.
See "Figure 4-26 Graph screen" on page 4-34.
To show power on the bottom axis of the graph. Toggles to [Show].
To show temperature on the bottom axis of the graph. Toggles to
[Power].
To choose scale of time period shown. Choices are 5 minutes, 30
minutes or 24 hours.
To cancel and return to the previous screen.
To move up through the zones.
To move down through the zones.
To send information to printer or USB memory stick.
See "Congure a Printer" on page 5-49.
4-35
© 2021 Mold-Masters (2007) Limited. All Rights Reserved.
OVERVIEW
M2+ Controller User Manual


 To Next Page