Principles of Operation
26 0112-0115 F
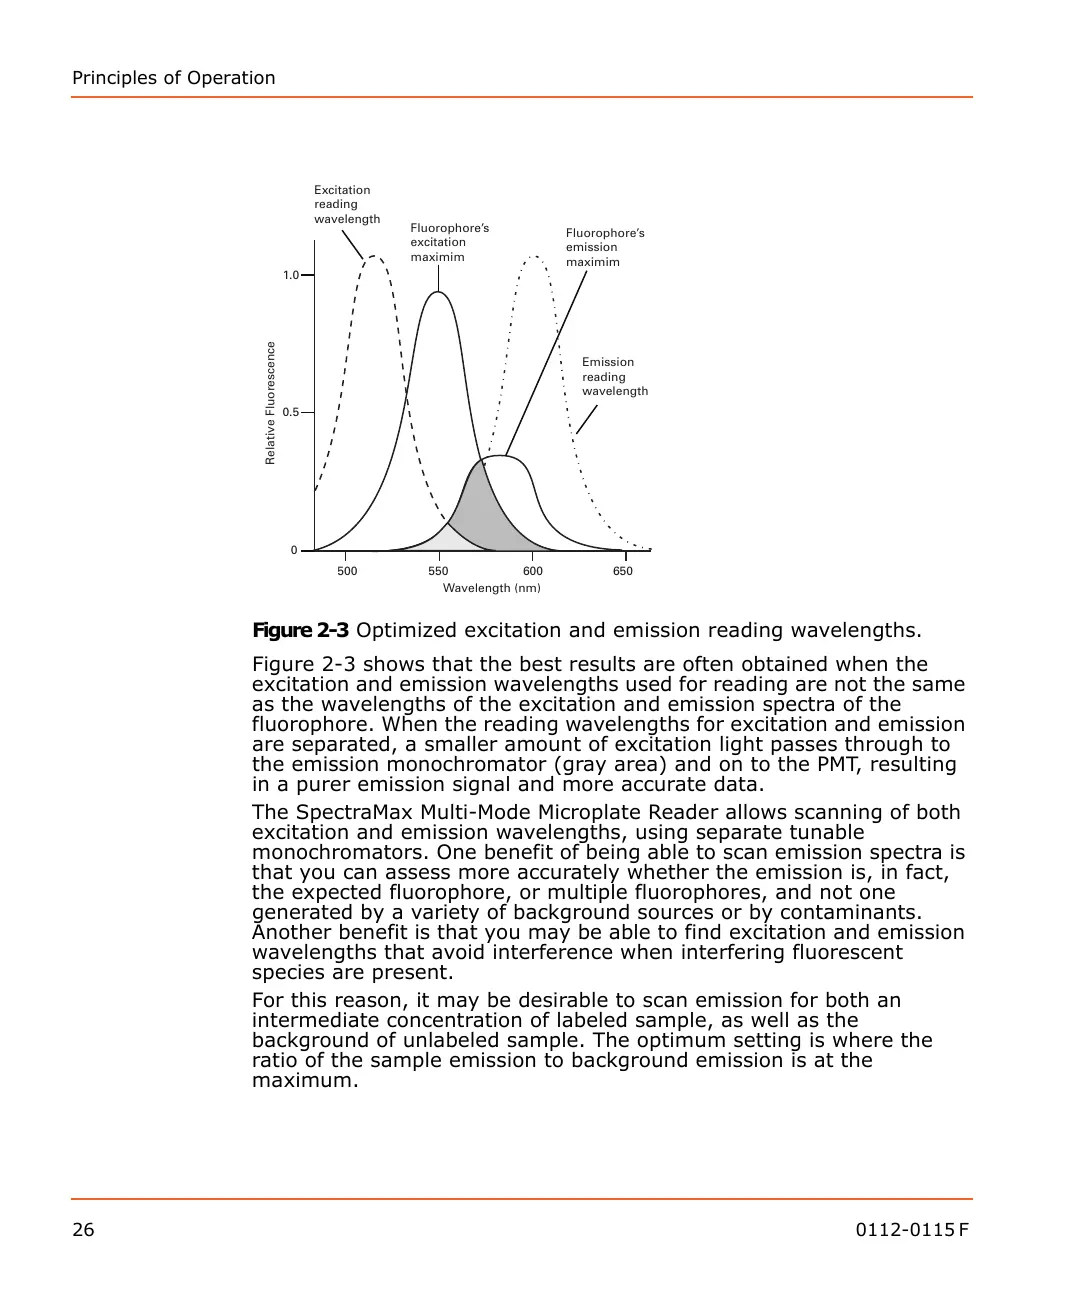
Figure 2-3 Optimized excitation and emission reading wavelengths.
Figure 2-3 shows that the best results are often obtained when the
excitation and emission wavelengths used for reading are not the same
as the wavelengths of the excitation and emission spectra of the
fluorophore. When the reading wavelengths for excitation and emission
are separated, a smaller amount of excitation light passes through to
the emission monochromator (gray area) and on to the PMT, resulting
in a purer emission signal and more accurate data.
The SpectraMax Multi-Mode Microplate Reader allows scanning of both
excitation and emission wavelengths, using separate tunable
monochromators. One benefit of being able to scan emission spectra is
that you can assess more accurately whether the emission is, in fact,
the expected fluorophore, or multiple fluorophores, and not one
generated by a variety of background sources or by contaminants.
Another benefit is that you may be able to find excitation and emission
wavelengths that avoid interference when interfering fluorescent
species are present.
For this reason, it may be desirable to scan emission for both an
intermediate concentration of labeled sample, as well as the
background of unlabeled sample. The optimum setting is where the
ratio of the sample emission to background emission is at the
maximum.
Wavelength (nm)
Relative Fluorescence
Excitation
reading
wavelength
Emission
reading
wavelength
Fluorophore’s
excitation
maximim
Fluorophore’s
emission
maximim
500 550 600 650
0
0.5
1.0
 Loading...