VS1 Operations and Maintenance Manual Operating the transmitter
Issue 3.1 2013-10-01 Page 2-43
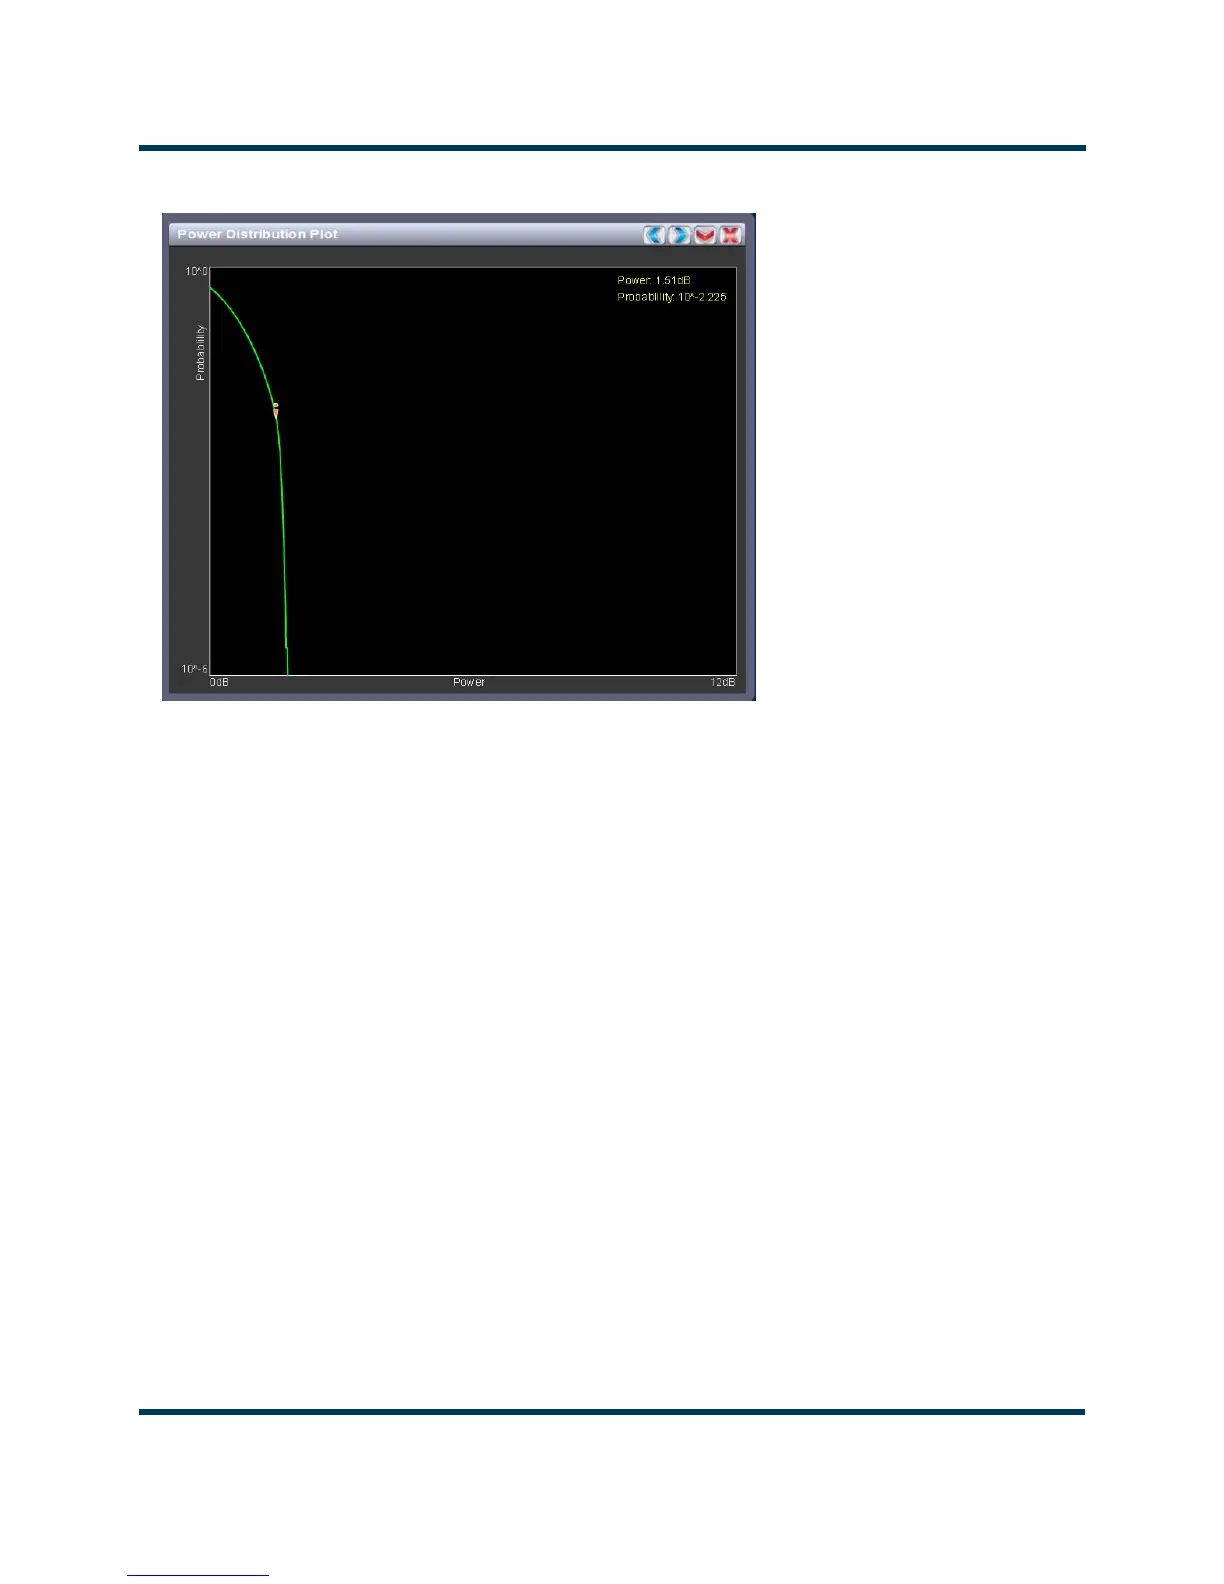
Figure 2.30: Power Distribution Plot
Power distribution
See Figure 2.30. Available only when the transmitter is used with a VSHD exciter. The exciter
measures the relative power levels of the signal and determines the probability of exceeding a given
power level, relative to the average power. The data is plotted in the Power Distribution Plot as a
CCDF (complementary cumulative distribution function). The x-axis displays the relative power level
in dB, with the reference representing the average power. The average power is 0db. The y-axis
displays the probability of exceeding that power level. This plot can be used to assess the distribution
of a given signal, and provides an indication of the amount of peak power capability required from
the transmitter in order to prevent peak clipping/distortion of the output signal.
Click the panel to display a cursor in the approximate area. The cursor position (power gain and
probability index) is noted in the upper, right-hand corner of the panel. Click on other areas of this
instrument panel to provide a coarse adjustment of the cursor position.
Use the left and right buttons as fine adjustments.
Use the maximize or minimize buttons as required.