To see details, in the Compute panes, click Show Details.
Monitor storage capacity
Monitoring the storage capacity of your environment is critical. Using the Storage Capacity pane, you can
determine your storage capacity efficiency gains with or without compression, deduplication, and thin
provisioning features enabled.
You can see the total physical storage space available in your cluster on the RAW tab, and information about
the provisioned storage on the EFFECTIVE tab.
To view cluster health, also look at the SolidFire Active IQ Dashboard. See Monitor
performance, capacity, and cluster health in NetApp SolidFire Active IQ.
Steps
1. Click the RAW tab, to see the total physical storage space used and available in your cluster.
Look at the vertical lines to determine whether your used capacity is less than the total or less than
Warning, Error, or Critical thresholds. Hover over the lines to see details.
You can set the threshold for Warning, which defaults to 3% below the Error threshold.
The Error and Critical thresholds are preset and not configurable by design. The Error
threshold indicates that less than one node of capacity remains in the cluster. For steps
on setting the threshold, see Setting cluster full threshold.
For details about the related cluster thresholds Element API, see
“getClusterFullThreshold” in the Element API Guide. To view details about block and
metadata capacity, see Understanding cluster fullness levels in the Element User Guide.
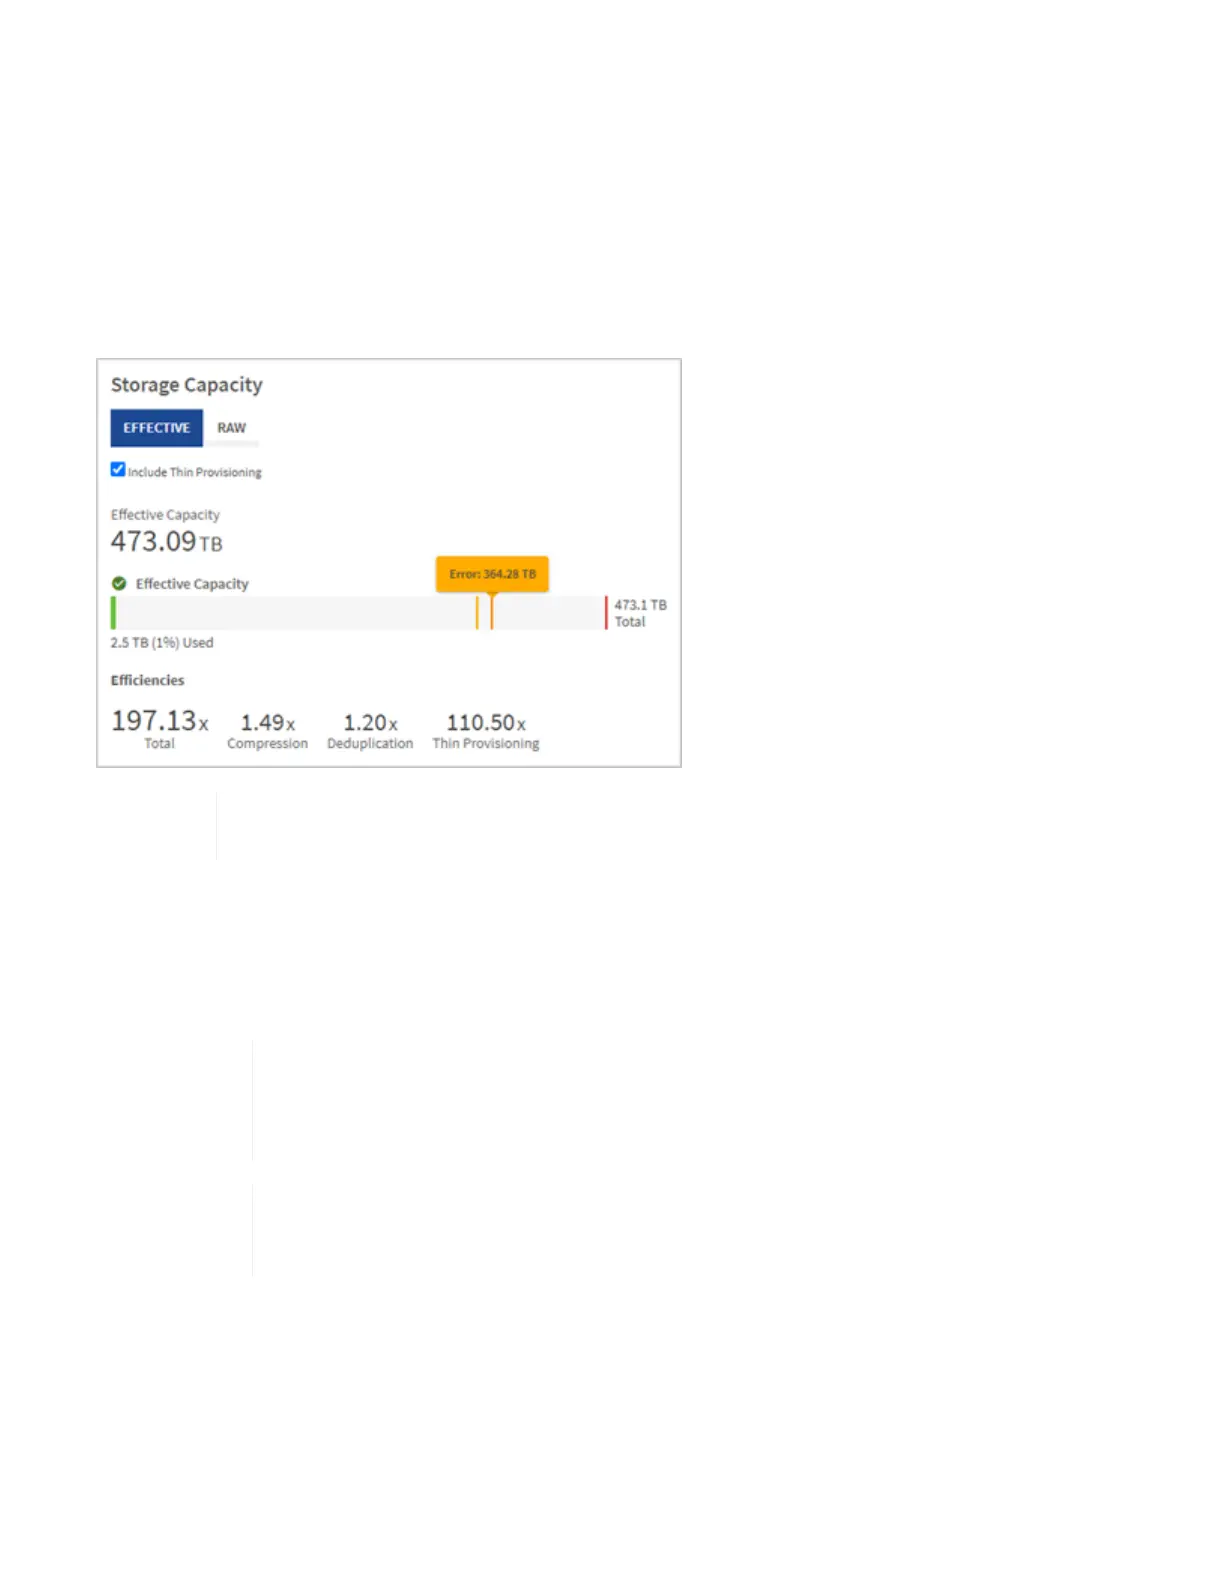
2. Click the EFFECTIVE tab, to see information about total storage provisioned to connected hosts and to see
efficiency ratings.
a. Optionally, check Include Thin Provisioning to see thin provisioning efficiency rates in the Effective
Capacity bar chart.
b. Effective Capacity bar chart: Look at the vertical lines to determine whether your used capacity is
less than the total or less than Warning, Error, or Critical thresholds. Similar to the Raw tab, you can