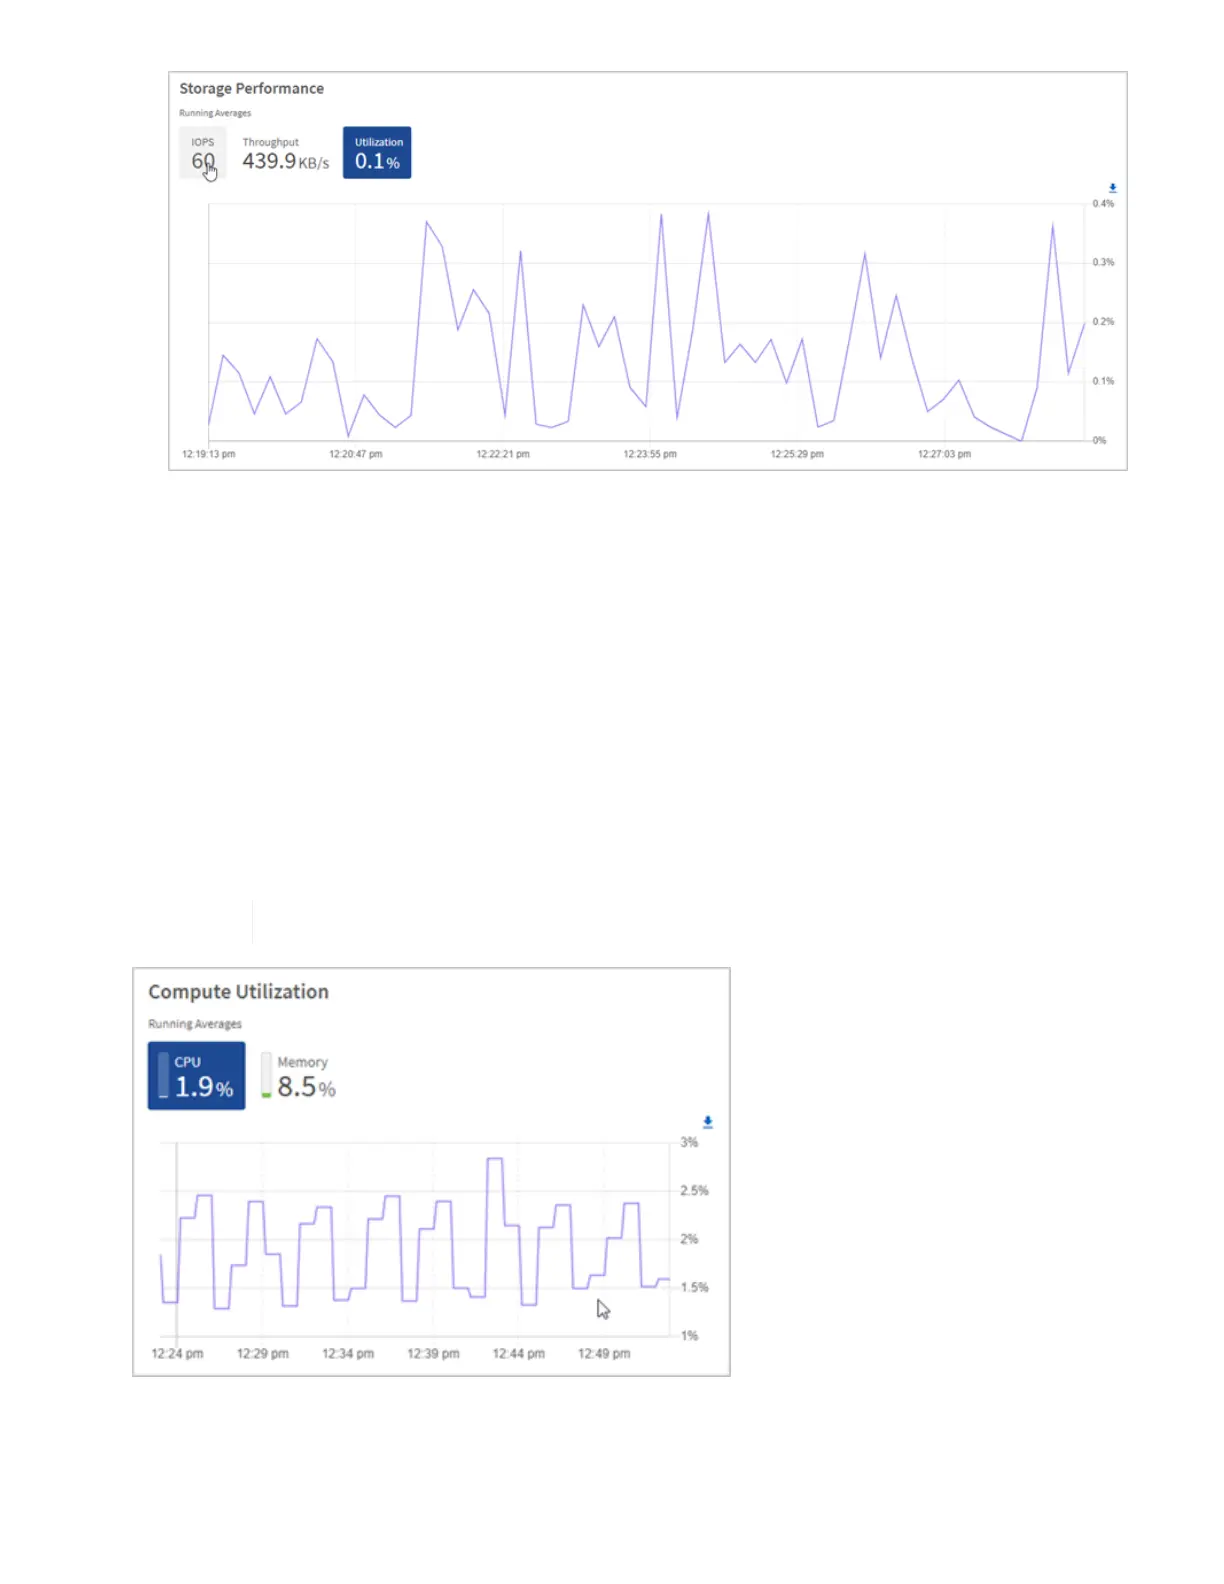
2. For further analysis, look at storage performance by using the NetApp Element Plug-in for vCenter Server.
Performance shown in the NetApp Element Plug-in for vCenter Server.
Monitor compute utilization
In addition to monitoring IOPS and throughput of your storage resources, you also might want to view the CPU
and memory usage of your compute assets. The total IOPS that a node can provide is based on the physical
characteristics of the node, for example, the number of CPUs, the CPU speed, and the amount of RAM.
Steps
1. View the Compute Utilization pane. Using both the CPU and Memory tabs, look for patterns or spikes in
utilization. Also look for continuously high usage, indicating that you might be nearing the maximum
utilization for the compute clusters.
This pane shows data only for those compute clusters managed by this installation.
a. CPU tab: See the current average of CPU utilization on the compute cluster.
b. Memory tab: See the current average memory usage on the compute cluster.