BTS User Manual
Neware Technology Ltd.
http://www.newarebattery.com
Figure 6-2 Open data display interface
3. Double-click“*.nda”file,start BTSDA.exe software to check and analysis the data.
6.2. Features
BTSDA Interface
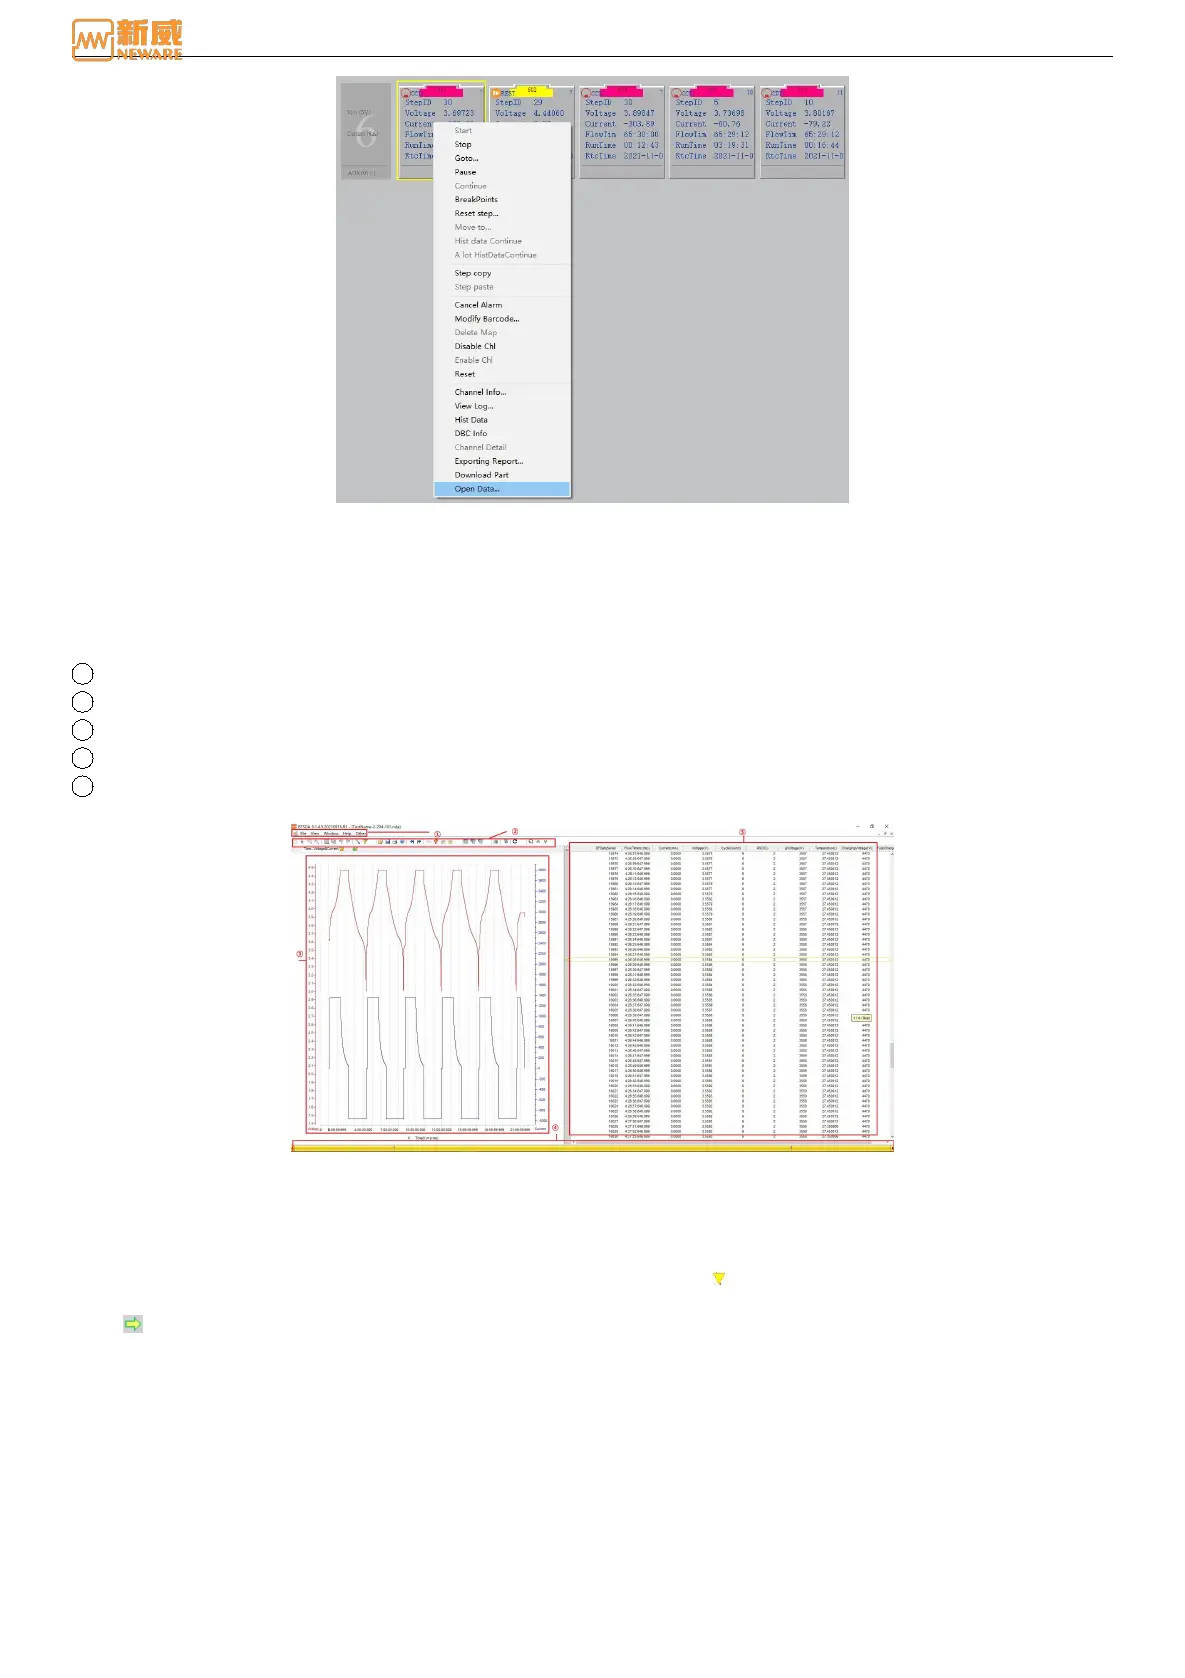
BTSDA interface includes menu bar, toolbar, graphics area, data area and segmented preview, as shown below:
1 Menu
2 Tools
3 Graphics area
4 Data segmented preview area
5 Data area
Figure 6-3 BTSDA Interface
Association Mapping
BTSDA adopts curve-data correlation display mode, and there is a one-to-one correspondence between data and curves.
The operation method is as follows:
Double-click a point in the "graph area" or "data area", and an triangle icon will appear at the corresponding point on the
curve (if the clicking position is beyond the range of X value, the endpoint value of the X axis shall prevail), and a yellow
arrow will appear in the "data area", pointing to the data record corresponding to the position of the curve, as shown
below. This operation is invalid when you double-click the data area loop layer data.