BTS User Manual
Neware Technology Ltd.
http://www.newarebattery.com
Figure 6-4 Diagram of curve-data association
Data segment preview
In a large amount of data with multiple cycles, the segmented data viewing tool can be used to realize the segmented data
viewing with specific cycles. The operation method is as following:
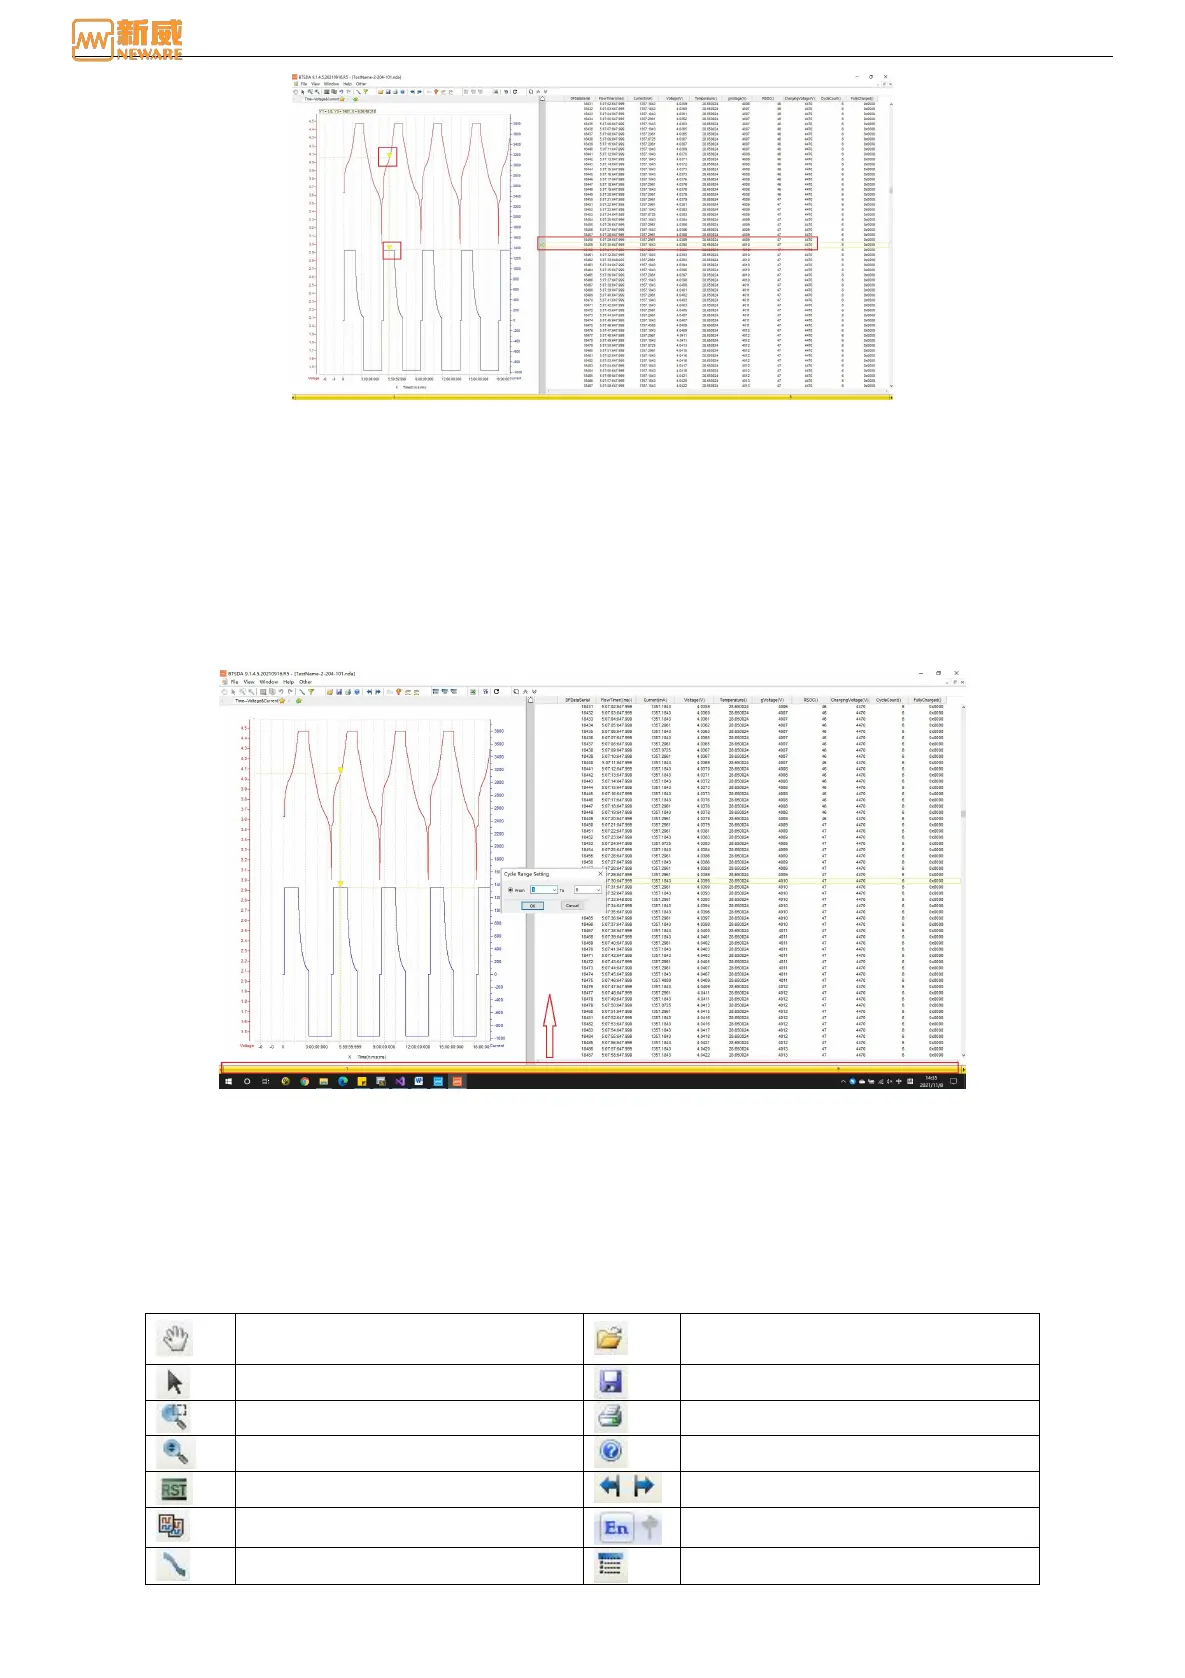
Double-click the yellow scroll bar at the bottom, labeled "Data segment Viewing tool," and in the pop-up Cycle Range
Setting box, set the display range of the cycle layer to be viewed, as shown in the figure.
Figure 6-5 Data sectional view setting
Menu
The menu bar is located below the title bar and provides users with global fields control over view and analysis, including
file operation, view switching, window adjustment, language selection, and Help.
Tools
In BTSDA software, many tools are integrated into the toolbar to facilitate the operation. The toolbar shortcuts are as
follows:
Form 9 Tools
Drag the graph using the Hand Shape
Tool
Use the arrow tool to select data items
Local curve magnifying tool
Restores the graph to its initial state
Copy graphics to the clipboard
Curve contrast control tool
Data area-cyclic layer folding/unfolding