19
Gain/Phase Mode
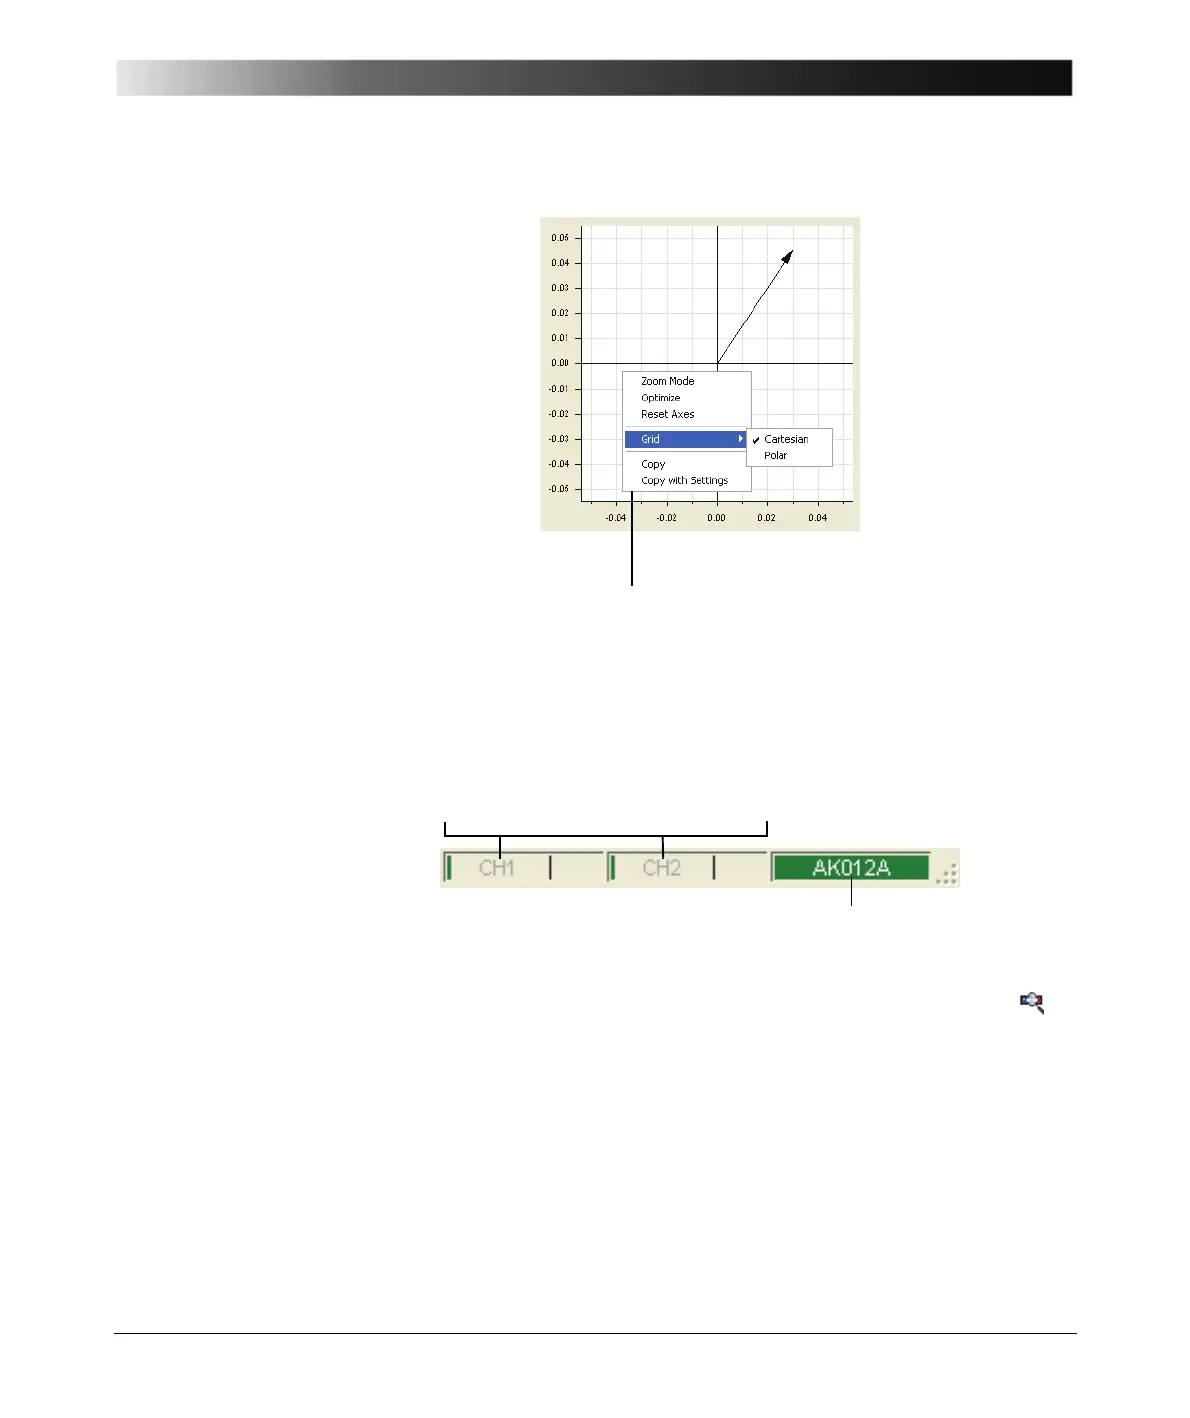
Figure 3-4:
Graphical display of
measurement results
Hint: Using the Copy and Copy with Settings functions you can easily export
your diagram into other Windows
®
applications. For more information, see
9.1 "Advanced Display Options" on page 101.
Figure 3-5:
Overload and
connection indicators
Hint: If the serial number field in the status bar displays No Device on red
background, check whether the Bode 100 is powered and connected to your
computer, and then click the Search and Reconnect Device toolbar button
to reconnect the Bode 100.
Right-click in the diagram to open the shortcut menu.
Use the shortcut menu to optimize the diagram, select the grid and zoom in the
diagram. After having zoomed in, click Optimize to get back to an optimized diagram.
Overload indicators for the channel 1 and channel 2 inputs. If you see a red bar, increase
the attenuation of the respective channel or reduce the source level to prevent the overload.
Serial number of the Bode 100