Operation
Operating Manual PITreader, PITreader Firmware V1.5.x
1004806-EN-08
| 48
10.3 Diagnostics
The PITreader provides options for device diagnostics and statistical evaluation.
} Diagnostics using the device LED
Information regarding evaluation of the device LED can be found under LED
indicator [ 46].
} Diagnostics using the diagnostic list (web application)
The diagnostic list contains a list of the active alarms. You can read the diagnostic list in
the web application under Diagnostics.
} Diagnostics using the diagnostic log (web application)
In the diagnostic log, the events are logged with a time stamp; i.e. the message is logged
by "Message arrived" and "Message cleared". You can read the diagnostic log in the web
application under Diagnostics.
Under Diagnostics -> Log you can use a filter to set whether All message types or only
Audit trail messages (messages about the process cycle) are to be displayed. You can
create a backup of the diagnostic messages selected in the filter via the Export log but-
ton. A CSV file is created during export.
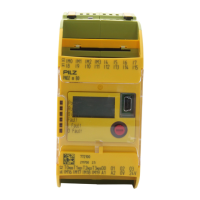
If you have connected a safe evaluation unit PIT m4SEU, all the information is logged via
the PIT m4SEU's status information interface.
} Statistics (web application)
You'll find information on various settings and evaluations under Statistics [ 48].
10.3.1 Statistics
You can make various settings for the statistical evaluations in the web application under
Diagnostics -> Statistics. Various information about the static evaluations is also dis-
played.
} Start date
The actual start data for statistical evaluation is displayed.
} Refresh button
The statistics can be recreated using the Refresh button.
} Define Start date and end date
By entering a start and end date it is possible to define a time window, for which the stat-
istical evaluations are displayed.
} Transponder area
The table under Transponder is only displayed if personal data logging is activated un-
der Configuration -> Settings -> Function. The transponder keys are identified in the
table by their security IDs (Security ID column).
Statistical values for a transponder key:
– Duration (total)
This column contains the total calculated time that a transponder key is inserted.
For format of time display see [1].