3-42
3 First Steps
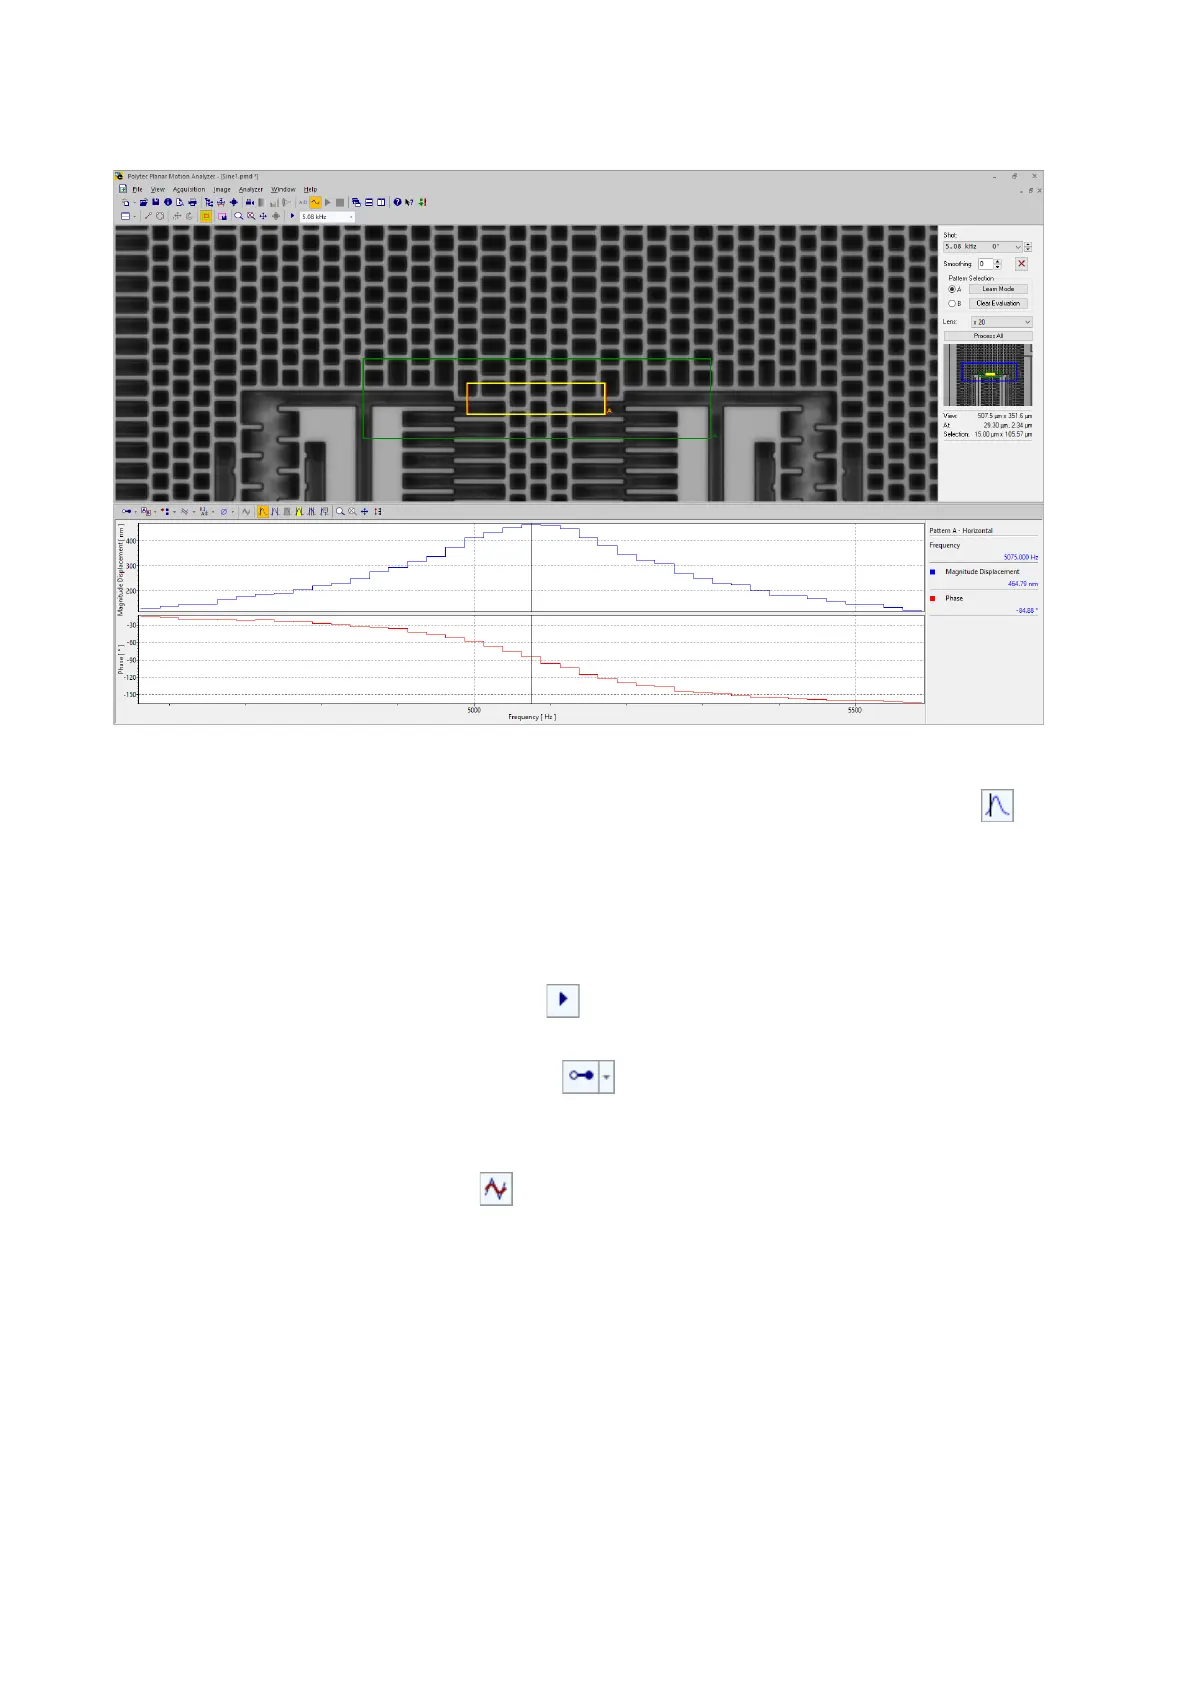
Figure 3.30: Display of the area of evaluation
37. In the menu bar, select Analyzer > Cursor (toolbar of the analyzer: ).
38. To set a cursor, click the high point of the diagram with the left mouse
button.
You can read the respective data in the readout. If the readout is not
visible in the analyzer, select
Analyzer > Readout
in the menu bar.
39. To start the animation of the data, select Image > Start/Stop Animation in
the menu bar (toolbar: ).
40. To display the time signal, select Analyzer > Domain in the menu bar
(toolbar of the analyzer: ).
41. Select Time in the pull-down menu.
42. To display the sine fit, select Analyzer > Sine Fit in the menu bar (toolbar
of the analyzer: ).
The sine fit is displayed in the analyzer.