page 48
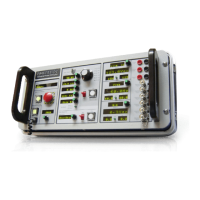
Industrial Power Corruptor Manual Rev 1.00
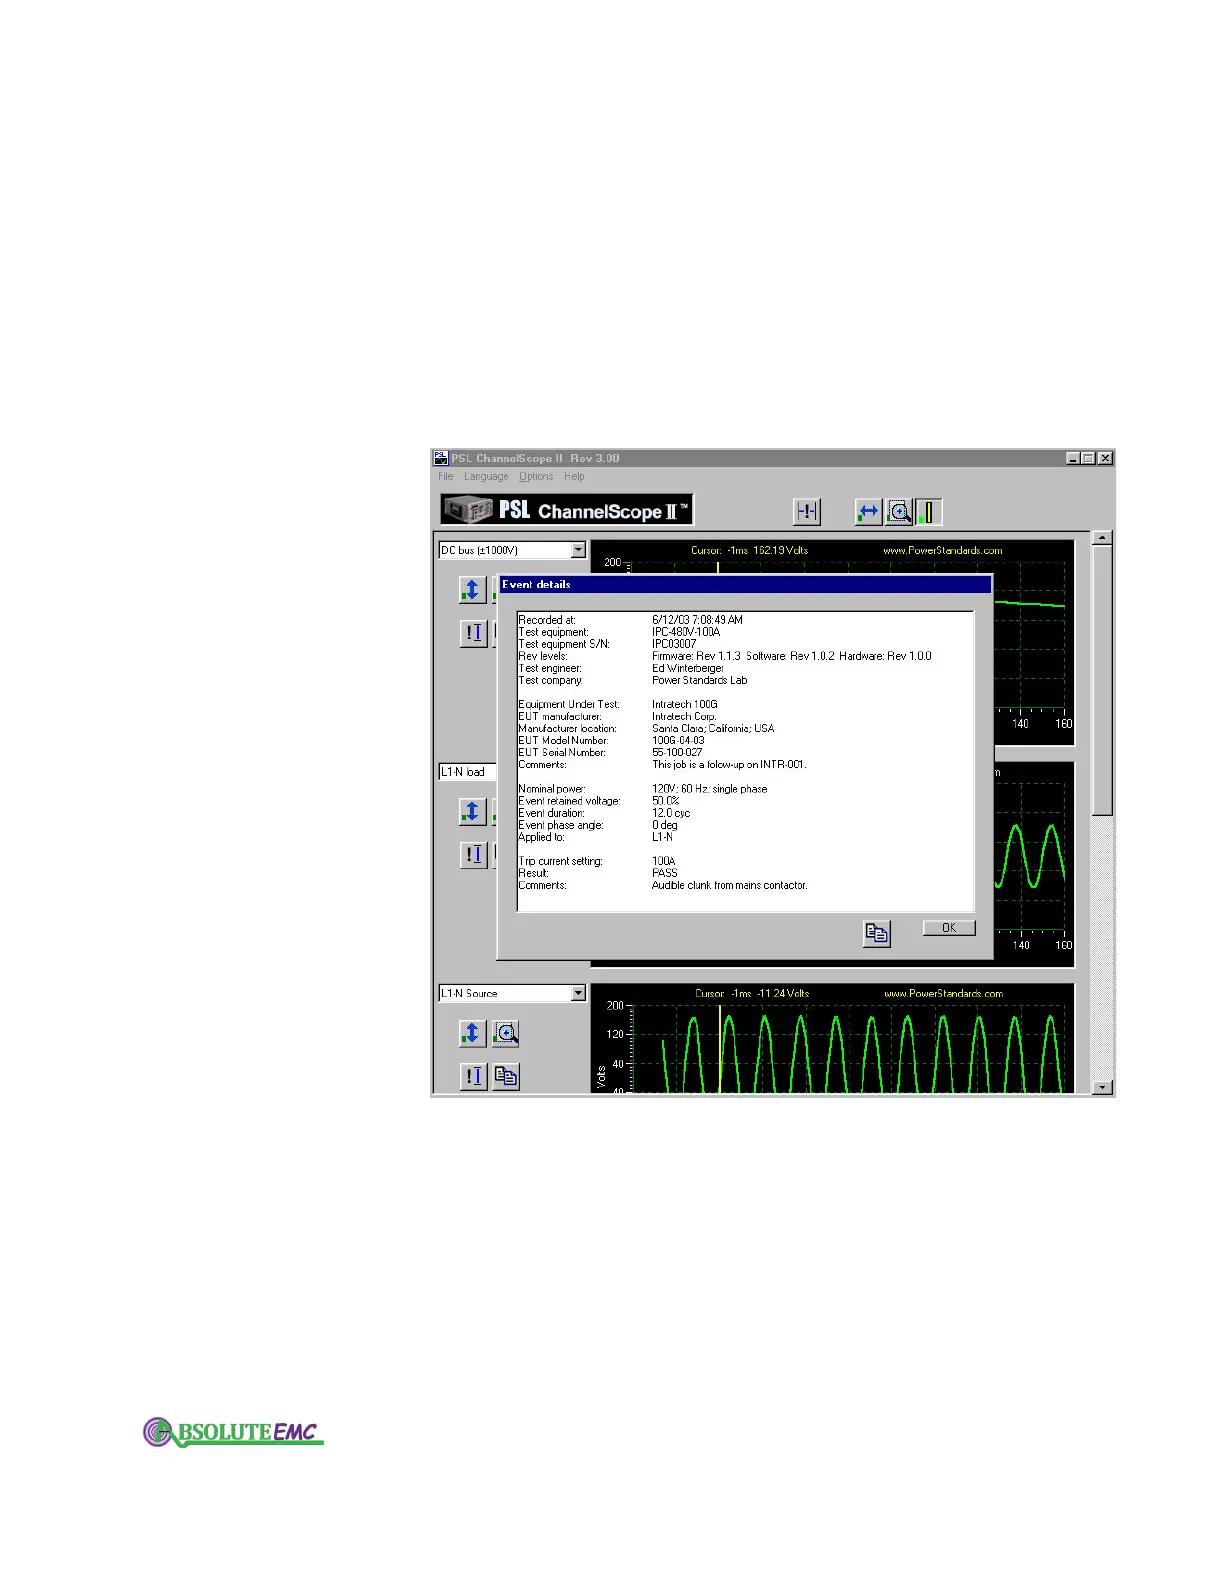
Start the ChannelScope II software, then use the File menu to open
the sample data file.
Under the Options menu, select "Event Details". You will see the
date and time the event was recorded, all of the information about the
test equipment and the Equipment Under Test, and - if you entered the
optional information during the download - comments about what
happened during the test. (Some of these event details are generated
automatically, some of them come from what you enter in the Test Setup
form, and some of them come from comments you entered before
downloading the data.)
You can copy the event details to your computer's clipboard by
clicking on the Copy icon button below the event details text.
Now look at the graphs. You can choose which values you want to
display with the drop-down lists to the left of each graph.
Note that the list includes both the waveforms, and the RMS values
of the waveforms. This can be very useful for analyzing maximum
RMS current after voltage dips, looking for peak breaker currents, etc.
(These are the sliding true-RMS values, calculated over one cycle and
advancing one sample per sample interval, so the initial cycle of data
may not be representative.)
You can zoom and scroll left and right, using the buttons at the top
of the ChannelScope II.
All of the graphs move left and right together.
To scroll or zoom, click on one of the buttons at the top, then place the
absolute-emc.com
Phone:703-774-7505
info@absolute-emc.com